High_Low v2 (ZigZag)_v1
Download script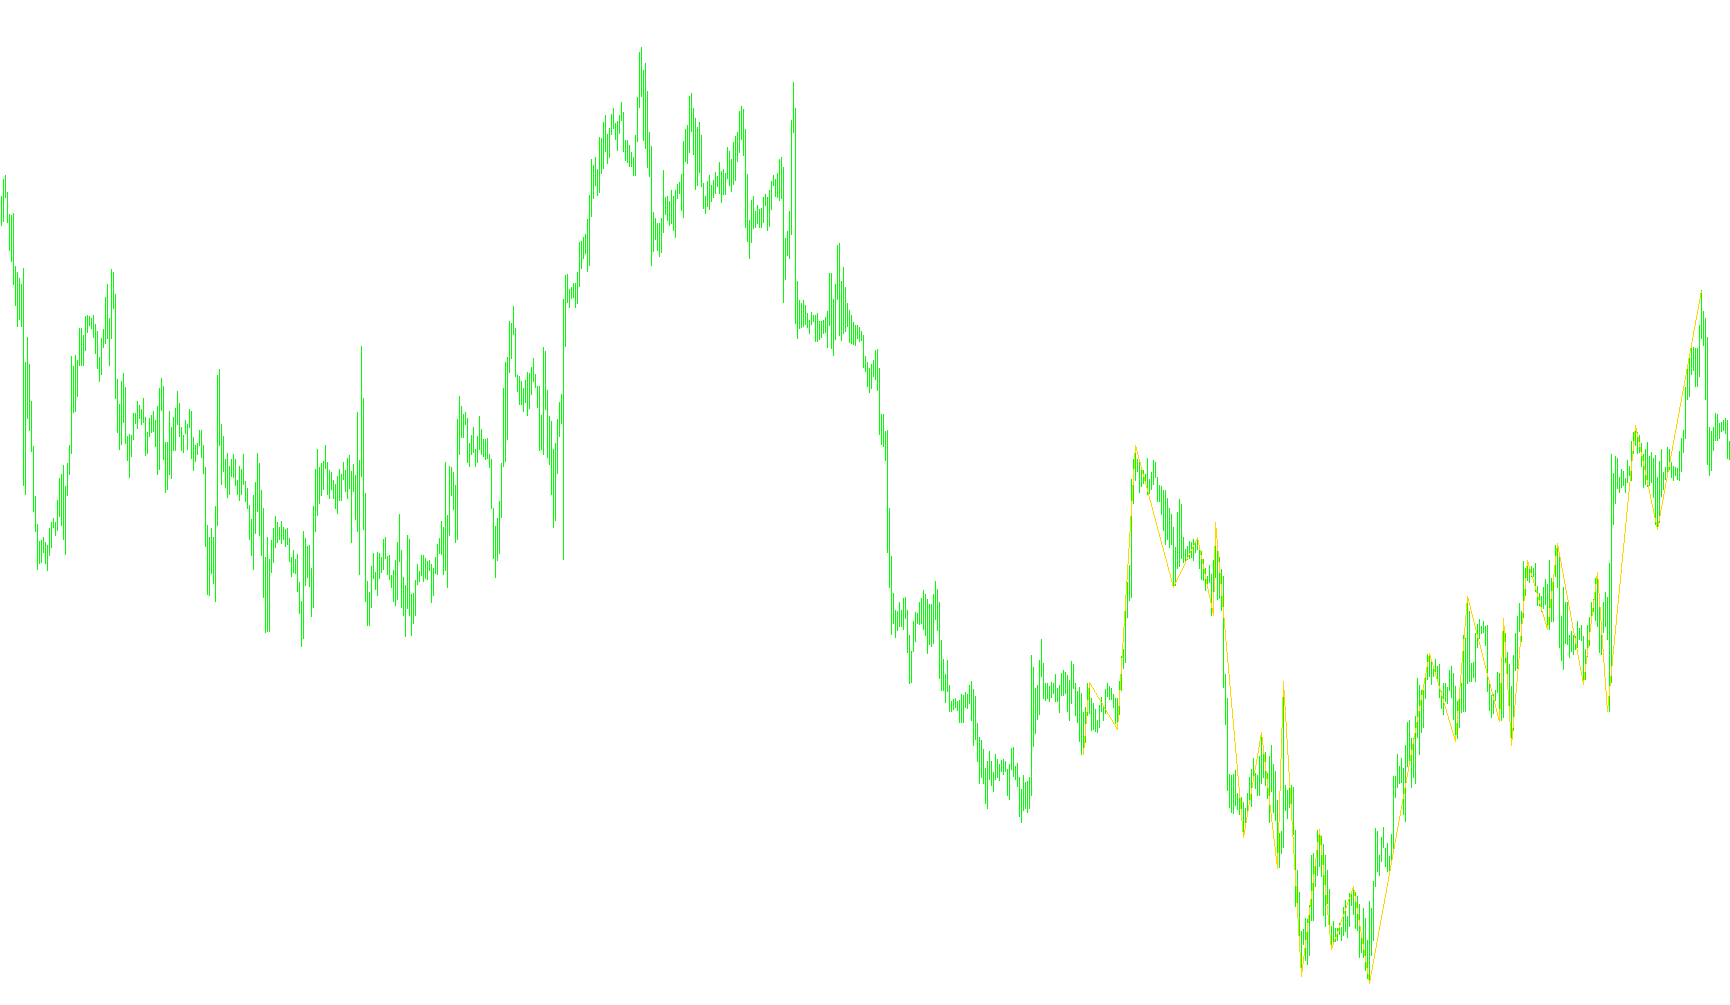
This tool is designed to identify and map significant price structure movements by analyzing historical price action. It essentially filters out the "noise" of minor market fluctuations to highlight the core highs and lows that define the overall trend.
Core Logic Overview
The script operates by scanning past price data to identify specific "Swing Points"—moments where the price reaches a local peak or valley relative to its immediate surroundings. Here is how it processes that information:
1. Neighborhood Analysis Instead of looking at every single price tick, the tool examines small clusters of candles (defined by a user-set length). By comparing a specific candle against its neighbors, the script determines if that point represents a significant deviation from the recent average.
2. Trend Identification The logic categorizes the price action into three distinct states:
- Upward Momentum: Identifying points where the high is higher than the surrounding area.
- Downward Momentum: Identifying points where the low is lower than the surrounding area.
- Transition Points: Recognizing when the market shifts from one direction to another (e.g., moving from an uptrend to a downtrend).
3. Peak and Valley Tracking As the script moves backward through historical data, it keeps track of the highest highs and lowest lows encountered during these momentum phases. It specifically looks for:
- The highest point reached during an upward move.
- The lowest point reached during a downward move.
4. Dynamic Mapping Once a transition in trend is confirmed, the script "pins" these significant coordinates. It captures the exact price level of the peak or valley and assigns it to its corresponding position on the chart. This allows the tool to draw a continuous path (a section) that connects these critical structural points.
Summary for the User
In simple terms, this tool acts as an automated "high-low" mapper. It ignores minor price wiggles and focuses on drawing a line that connects the major turning points of the market. By highlighting these peaks and valleys, it provides a visual representation of the market's skeletal structure, helping you see the primary path the price has taken over time.
//+------------------------------------------------------------------+
//|                                         High_Low v2 (ZigZag).mq4 |
//|                                          rewritten by CrazyChart |
//|                                                                  |
//+------------------------------------------------------------------+
#property copyright "rewritten by CrazyChart"
#property link      ""

#property indicator_chart_window
#property indicator_buffers 1
#property indicator_color1 Blue
//---- input parameters
extern int       barn=300;
extern int       Length=6;
//---- buffers
double ExtMapBuffer1[];
//double ExtMapBuffer2[];
//+------------------------------------------------------------------+
//| Custom indicator initialization function                         |
//+------------------------------------------------------------------+
int init()
  {
//---- indicators
   SetIndexEmptyValue(0,0.0);
  //SetIndexDrawBegin(0, barn);
   SetIndexStyle(0,DRAW_SECTION);
   SetIndexBuffer(0,ExtMapBuffer1);

//----
   return(0);
  }
//+------------------------------------------------------------------+
//| Custor indicator deinitialization function                       |
//+------------------------------------------------------------------+
int deinit()
  {

   return(0);
  }
//+------------------------------------------------------------------+
//| Custom indicator iteration function                              |
//+------------------------------------------------------------------+
int start()
  {
   int    counted_bars=IndicatorCounted();
   int shift,Swing,Swing_n,uzl,i,zu,zd,mv;
   double LL,HH,BH,BL,NH,NL;
   double Uzel[10000][3];
   string text;
// loop from first bar to current bar (with shift=0)
      Swing_n=0;Swing=0;uzl=0;
      BH =High[barn];BL=Low[barn];zu=barn;zd=barn;

for (shift=barn;shift>=0;shift--) {
      LL=10000000;HH=-100000000;
   for (i=shift+Length;i>=shift+1;i--) {
         if (Low[i]< LL) {LL=Low[i];};
         if (High[i]>HH) {HH=High[i];};
   };


   if (Low[shift]<LL && High[shift]>HH){
      Swing=2;
      if (Swing_n==1) {zu=shift+1;};
      if (Swing_n==-1) {zd=shift+1;};
   } else {
      if (Low[shift]<LL) {Swing=-1;};
      if (High[shift]>HH) {Swing=1;};
   };

   if (Swing!=Swing_n && Swing_n!=0) {
   if (Swing==2) {
      Swing=-Swing_n;BH = High[shift];BL = Low[shift];
   };
      uzl=uzl+1;
   if (Swing==1) {
      Uzel[uzl][1]=zd;
      Uzel[uzl][2]=BL;
   };
   if (Swing==-1) {
      Uzel[uzl][1]=zu;
      Uzel[uzl][2]=BH;
   };
      BH = High[shift];
      BL = Low[shift];
   };

   if (Swing==1) {
      if (High[shift]>=BH) {BH=High[shift];zu=shift;};};
      if (Swing==-1) {
          if (Low[shift]<=BL) {BL=Low[shift]; zd=shift;};};
      Swing_n=Swing;
   };
   for (i=1;i<=uzl;i++) {
      //text=DoubleToStr(Uzel[i][1],0);
      //text=;
         mv=StrToInteger(DoubleToStr(Uzel[i][1],0));
      ExtMapBuffer1[mv]=Uzel[i][2];
   };


   return(0);
  }
//+------------------------------------------------------------------+
Comments