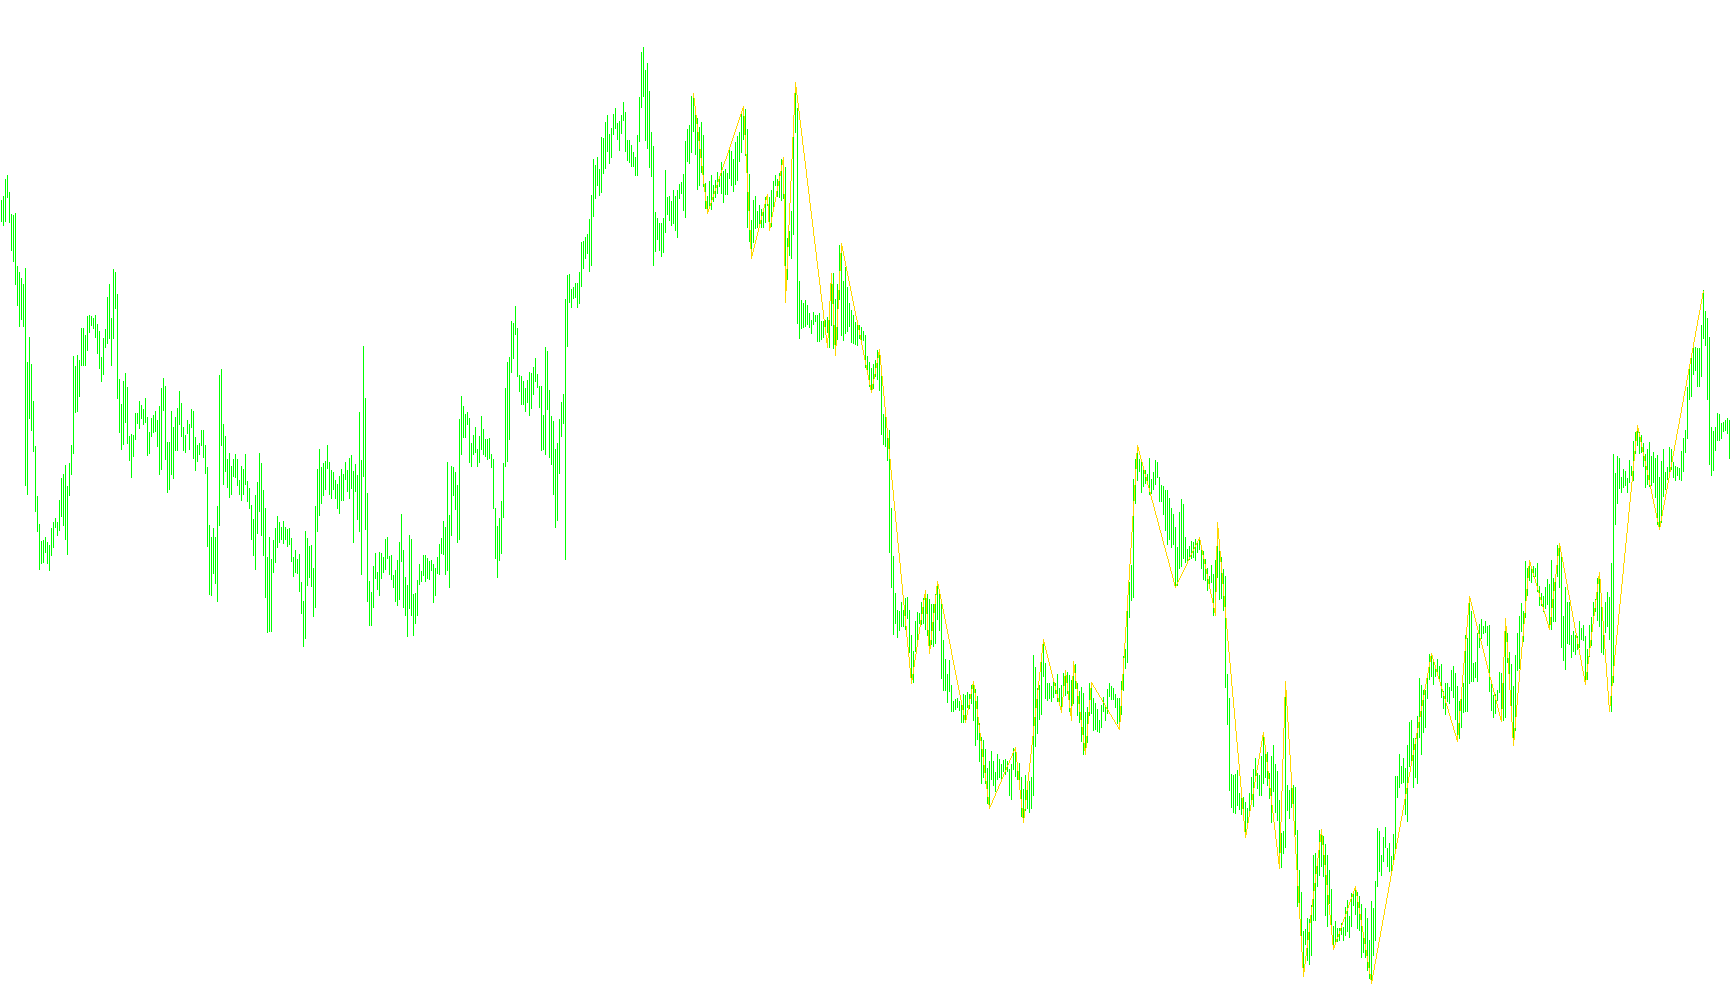
This tool is designed to identify and map out significant structural turning points in price action on a trading chart. Rather than highlighting every minor price fluctuation, the logic focuses on filtering out "noise" to highlight major highs and lows, creating a clear visual path of market trends.
Core Logic and Workflow
The script operates by analyzing historical price data over a specific lookback period (determined by the user-defined settings). Here is how it processes that data:
1. Neighborhood Analysis For every point on the chart, the tool looks at a small cluster of nearby bars. It identifies the highest and lowest prices within that immediate neighborhood to establish a baseline for what constitutes a "significant" move versus a minor price wiggle.
2. Swing Detection The logic evaluates each price bar against these baselines. It classifies movements into three categories:
- Upward Momentum: When a price point exceeds the recent high, it flags a potential upward swing.
- Downward Momentum: When a price point falls below the recent low, it flags a potential downward swing.
- Pivot Points: When the momentum shifts—for example, moving from an upward trend to a downward trend—the script identifies that specific moment as a "Swing" point.
3. Peak and Trough Refinement As the tool moves forward through the timeline, it continuously updates its memory of these swing points. If it finds a new high that is higher than the previous one (during an uptrend) or a new low that is lower than the previous one (during a downtrend), it updates the "peak" or "trough" to ensure the visual output reflects the true extremes of the market movement.
4. Visual Mapping Finally, the tool takes all these refined high and low points and connects them. It stores the coordinates of these significant turns and draws a continuous line (a "section") across the chart.
User Experience Summary
The end result is a streamlined visual representation of market structure. Instead of seeing every tick of price change, the user sees a clean line that connects major peaks and valleys. This allows for a clearer understanding of the prevailing market trend, making it easier to identify support levels, resistance zones, and structural shifts in the price action.
//+------------------------------------------------------------------+
//|                                         High_Low v2 (ZigZag).mq4 |
//|
//|                                 Conversion only                    |
//+------------------------------------------------------------------+
#property copyright ""
#property link      ""

#property indicator_chart_window
#property indicator_buffers 1
#property indicator_color1 Red
//---- input parameters
extern int       barn=500;
extern int       Length=6;
//---- buffers
double ExtMapBuffer1[];

//+------------------------------------------------------------------+
//| Custom indicator initialization function                         |
//+------------------------------------------------------------------+
int init()
  {
//---- indicators
   SetIndexEmptyValue(0,0.0);
  //SetIndexDrawBegin(0, barn);
   SetIndexStyle(0,DRAW_SECTION);
   SetIndexBuffer(0,ExtMapBuffer1);

//----
   return(0);
  }
//+------------------------------------------------------------------+
//| Custor indicator deinitialization function                       |
//+------------------------------------------------------------------+
int deinit()
  {

   return(0);
  }
//+------------------------------------------------------------------+
//| Custom indicator iteration function                              |
//+------------------------------------------------------------------+
int start()
  {
   int    counted_bars=IndicatorCounted();
   int shift,Swing,Swing_n,uzl,i,zu,zd,mv;
   double LL,HH,BH,BL,NH,NL;
   double Uzel[10000][3];
   string text;
// loop from first bar to current bar (with shift=0)
      Swing_n=0;Swing=0;uzl=0;
      BH =High[barn];BL=Low[barn];zu=barn;zd=barn;

for (shift=barn;shift>=0;shift--) {
      LL=10000000;HH=-100000000;
   for (i=shift+Length;i>=shift+1;i--) {
         if (Low[i]< LL) {LL=Low[i];}
         if (High[i]>HH) {HH=High[i];}
   }


   if (Low[shift]<LL && High[shift]>HH){
      Swing=2;
      if (Swing_n==1) {zu=shift+1;}
      if (Swing_n==-1) {zd=shift+1;}
   } else {
      if (Low[shift]<LL) {Swing=-1;}
      if (High[shift]>HH) {Swing=1;}
   }

   if (Swing!=Swing_n && Swing_n!=0) {
   if (Swing==2) {
      Swing=-Swing_n;BH = High[shift];BL = Low[shift];
   }
      uzl=uzl+1;
   if (Swing==1) {
      Uzel[uzl][1]=zd;
      Uzel[uzl][2]=BL;
   }
   if (Swing==-1) {
      Uzel[uzl][1]=zu;
      Uzel[uzl][2]=BH;
   }
      BH = High[shift];
      BL = Low[shift];
   }

   if (Swing==1) {
      if (High[shift]>=BH) {BH=High[shift];zu=shift;}}
      if (Swing==-1) {
          if (Low[shift]<=BL) {BL=Low[shift]; zd=shift;}}
      Swing_n=Swing;
   }
   for (i=1;i<=uzl;i++) {
      //text=DoubleToStr(Uzel[i][1],0);
      //text=;
         mv=StrToInteger(DoubleToStr(Uzel[i][1],0));
      ExtMapBuffer1[mv]=Uzel[i][2];
   }


   return(0);
  }
//+------------------------------------------------------------------+
Comments