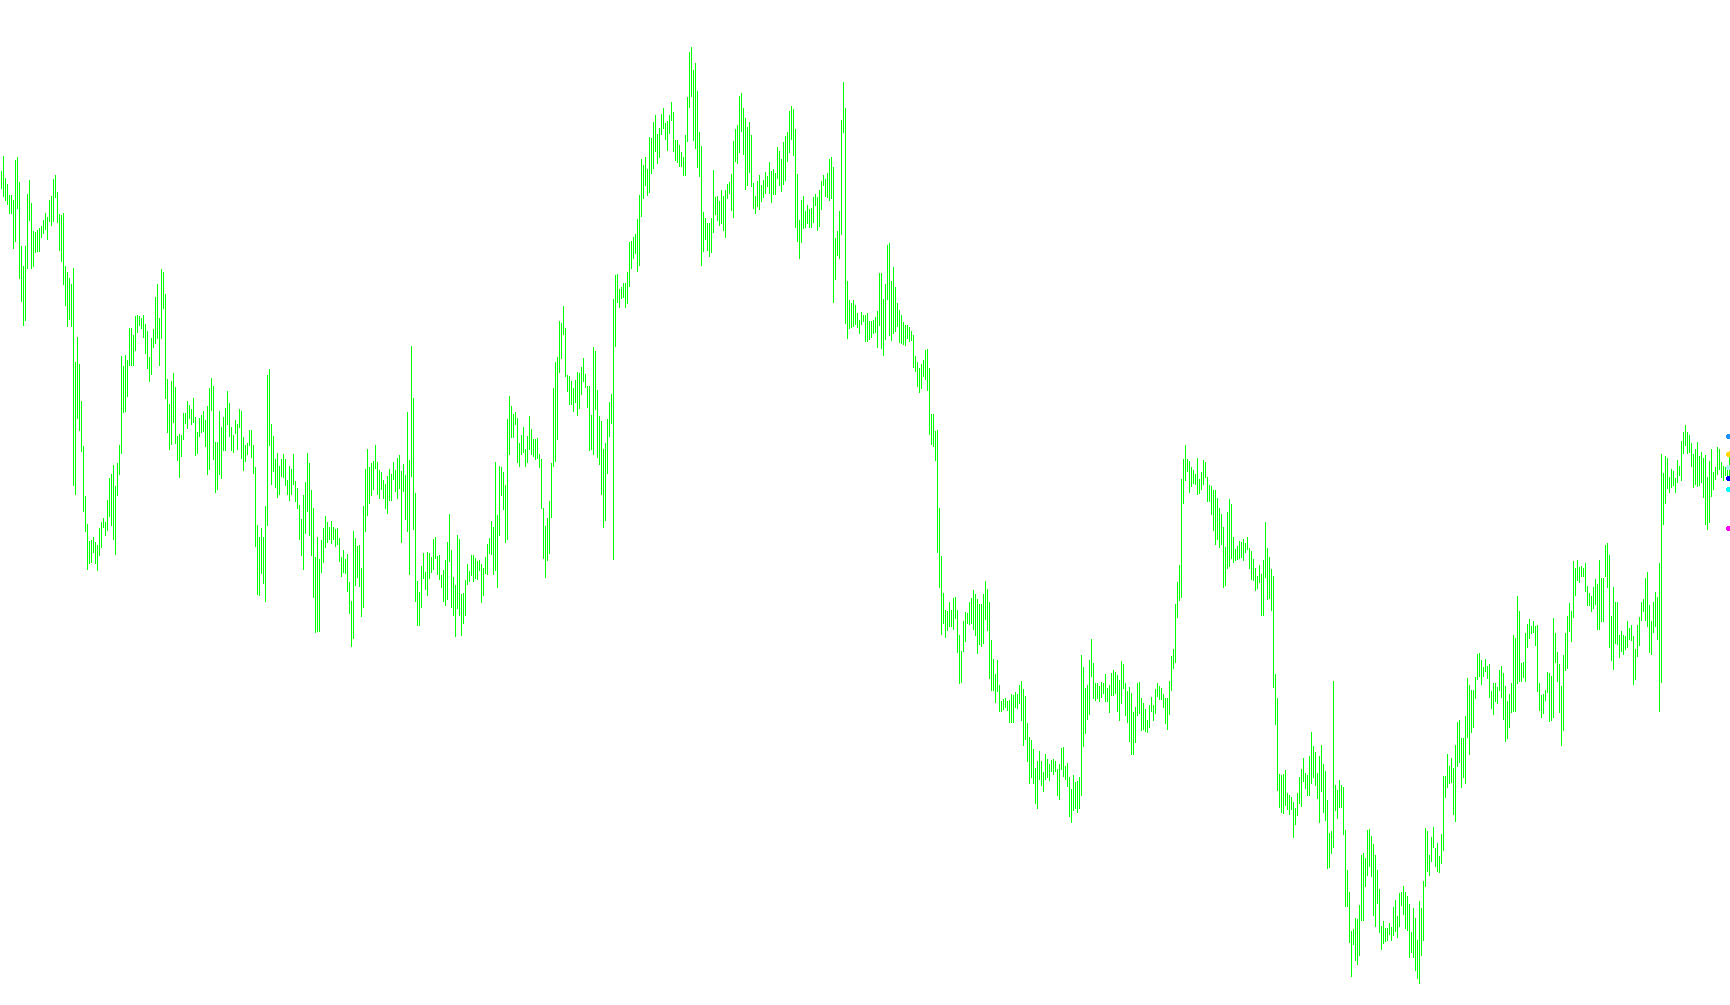
This script functions as a sophisticated visual tool designed to identify and highlight significant price levels on a trading chart. Its primary goal is to automatically detect "zones of interest" where the market has shown significant historical interaction.
Core Logic Overview
The script works by performing a comprehensive scan of historical price data to find specific price points that have been touched or "hit" most frequently. It follows a systematic multi-step process to identify eight distinct levels:
1. Historical Scanning and Density Tracking The tool begins by analyzing every price point within a specific range relative to the current market price. For every possible price step in that range, it counts how many times the high or low of a historical candle has touched that exact price (within a very small margin).
2. Primary Level Identification It first identifies the "strongest" level—the price point with the highest number of historical touches. This is established as your primary level of interest.
3. Sequential Secondary Level Detection Once the strongest level is found, the script systematically searches for the next strongest levels (levels 2 through 8). However, it does not simply pick the next highest counts. It follows a strict set of rules:
- Ranked Importance: Each subsequent level must have a lower frequency of touches than the level preceding it.
- Minimum Distance: To ensure the chart isn't cluttered with overlapping markers, the script enforces a minimum distance between levels. It ensures that any new level identified is sufficiently far away from all previously established levels.
Visual Output and User Experience
Instead of drawing continuous lines that can clutter the screen, the script identifies these key price points and marks them on your chart using specific visual indicators (arrows).
Key Features for the User:
- Automatic Filtering: The logic automatically discards "noisy" price points that are too close to each other, ensuring that only the most significant unique levels are displayed.
- Dynamic Updates: The tool recalculates these levels based on the total history available on your chart, providing a snapshot of where the market has historically preferred to react.
- Real-time Data: A data comment is provided on the chart, allowing you to see the exact numerical values and "hit counts" (the $k$ and $n$ values) for the levels being detected.
In summary, this script automates the tedious task of identifying historical support and resistance by calculating exactly where the market has "lingered" the most, highlighting those areas so you can better anticipate potential price reactions.
//+------------------------------------------------------------------+
//|                                                     DT-Level.mq4 |
//|                      Copyright © 2005, MetaQuotes Software Corp. |
//|                                        http://www.metaquotes.net |
//+------------------------------------------------------------------+
#property copyright "Copyright © 2005, MetaQuotes Software Corp."
#property link      "http://www.metaquotes.net"

#property indicator_chart_window
#property indicator_buffers 8
#property indicator_color1 Red
#property indicator_color2 Orange
#property indicator_color3 Yellow
#property indicator_color4 Lime
#property indicator_color5 Aqua
#property indicator_color6 Blue
#property indicator_color7 BlueViolet
#property indicator_color8 DarkViolet
//---- input parameters
extern int       ExtParam1;
//---- buffers
double ExtMapBuffer1[];
double ExtMapBuffer2[];
double ExtMapBuffer3[];
double ExtMapBuffer4[];
double ExtMapBuffer5[];
double ExtMapBuffer6[];
double ExtMapBuffer7[];
double ExtMapBuffer8[];

double level1,level2,level3,level4,level5,level6,level7,level8;
int n1,n2,n3,bar,n4,n5,n6,n7,n8;
//+------------------------------------------------------------------+
//| Custom indicator initialization function                         |
//+------------------------------------------------------------------+
int init()
  {
//---- indicators
   SetIndexStyle(0,DRAW_ARROW);
   SetIndexArrow(0,159);
   SetIndexEmptyValue(0,0.0);
   SetIndexBuffer(0,ExtMapBuffer1);
   SetIndexStyle(1,DRAW_ARROW);
   SetIndexArrow(1,159);
   SetIndexEmptyValue(1,0.0);
   SetIndexBuffer(1,ExtMapBuffer2);
   SetIndexStyle(2,DRAW_ARROW);
   SetIndexArrow(2,159);
   SetIndexEmptyValue(2,0.0);
   SetIndexBuffer(2,ExtMapBuffer3);
   SetIndexStyle(3,DRAW_ARROW);
   SetIndexArrow(3,159);
   SetIndexEmptyValue(3,0.0);
   SetIndexBuffer(3,ExtMapBuffer4);
   SetIndexStyle(4,DRAW_ARROW);
   SetIndexArrow(4,159);
   SetIndexEmptyValue(4,0.0);
   SetIndexBuffer(4,ExtMapBuffer5);
   SetIndexStyle(5,DRAW_ARROW);
   SetIndexArrow(5,159);
   SetIndexEmptyValue(5,0.0);
   SetIndexBuffer(5,ExtMapBuffer6);
   SetIndexStyle(6,DRAW_ARROW);
   SetIndexArrow(6,159);
   SetIndexEmptyValue(6,0.0);
   SetIndexBuffer(6,ExtMapBuffer7);
   SetIndexStyle(7,DRAW_ARROW);
   SetIndexArrow(7,159);
   SetIndexEmptyValue(7,0.0);
   SetIndexBuffer(7,ExtMapBuffer8);
//----
   return(0);
  }
//+------------------------------------------------------------------+
//| Custor indicator deinitialization function                       |
//+------------------------------------------------------------------+
int deinit()
  {
//----

//----
   return(0);
  }
//+------------------------------------------------------------------+
//| Custom indicator iteration function                              |
//+------------------------------------------------------------------+
int start()
  {
   int    counted_bars=IndicatorCounted();
   int cnt,k,i,j;
   double h=320;
//----
   double cur_price,q=26;


 if ( bar!=Bars )
 {
   cur_price=((High[1]+Low[1])/2)+((h*Point)/2);
   for (i=0; i<=h; i++)
   {
      k=0;
      for (cnt=1; cnt<Bars; cnt++)
         {
            if ( MathAbs(High[cnt]-cur_price)<4*Point || MathAbs(cur_price-Low[cnt])<4*Point ) k++;
         }
            if ( k>n1 ) {  n1=k; level1=cur_price; }
   cur_price=cur_price-Point;
  }
    cur_price=((High[1]+Low[1])/2)+((h*Point)/2);
   for (i=0; i<=h; i++)
   {
      k=0;
      for (cnt=1; cnt<Bars; cnt++)
         {
            if ( MathAbs(High[cnt]-cur_price)<4*Point || MathAbs(cur_price-Low[cnt])<4*Point ) k++;
         }
            if ( k<n1 && k>n2 && MathAbs(level1-cur_price)>q*Point && MathAbs(level3-cur_price)>q*Point
                  && MathAbs(level4-cur_price)>q*Point && MathAbs(level5-cur_price)>q*Point
                  && MathAbs(level6-cur_price)>q*Point && MathAbs(level7-cur_price)>q*Point && MathAbs(level8-cur_price)>q*Point)
                  { n2=k; level2=cur_price; }
    cur_price=cur_price-Point;
  }
  cur_price=((High[1]+Low[1])/2)+((h*Point)/2);
   for (i=0; i<=h; i++)
   {
      k=0;
      for (cnt=1; cnt<Bars; cnt++)
         {
            if ( MathAbs(High[cnt]-cur_price)<4*Point || MathAbs(cur_price-Low[cnt])<4*Point ) k++;
         }
            if ( k<n2 && k>n3 && MathAbs(level1-cur_price)>q*Point && MathAbs(level2-cur_price)>q*Point
                  && MathAbs(level4-cur_price)>q*Point && MathAbs(level5-cur_price)>q*Point
                  && MathAbs(level6-cur_price)>q*Point && MathAbs(level7-cur_price)>q*Point && MathAbs(level8-cur_price)>q*Point)
                  { n3=k; level3=cur_price; }
    cur_price=cur_price-Point;
  }
  cur_price=((High[1]+Low[1])/2)+((h*Point)/2);
   for (i=0; i<=h; i++)
   {
      k=0;
      for (cnt=1; cnt<Bars; cnt++)
         {
            if ( MathAbs(High[cnt]-cur_price)<4*Point || MathAbs(cur_price-Low[cnt])<4*Point ) k++;
         }
            if ( k<n3 && k>n4 && MathAbs(level1-cur_price)>q*Point && MathAbs(level2-cur_price)>q*Point
                  && MathAbs(level3-cur_price)>q*Point && MathAbs(level5-cur_price)>q*Point
                  && MathAbs(level6-cur_price)>q*Point && MathAbs(level7-cur_price)>q*Point && MathAbs(level8-cur_price)>q*Point)
                  { n4=k; level4=cur_price; }
     cur_price=cur_price-Point;
   }
   cur_price=((High[1]+Low[1])/2)+((h*Point)/2);
   for (i=0; i<=h; i++)
   {
      k=0;
      for (cnt=1; cnt<Bars; cnt++)
         {
            if ( MathAbs(High[cnt]-cur_price)<4*Point || MathAbs(cur_price-Low[cnt])<4*Point ) k++;
         }
            if ( k<n4 && k>n5 && MathAbs(level1-cur_price)>q*Point && MathAbs(level2-cur_price)>q*Point
                  && MathAbs(level3-cur_price)>q*Point && MathAbs(level4-cur_price)>25*Point
                  && MathAbs(level6-cur_price)>q*Point && MathAbs(level7-cur_price)>q*Point && MathAbs(level8-cur_price)>q*Point)
                  { n5=k; level5=cur_price; }
   cur_price=cur_price-Point;
   }
   cur_price=((High[1]+Low[1])/2)+((h*Point)/2);
   for (i=0; i<=h; i++)
   {
      k=0;
      for (cnt=1; cnt<Bars; cnt++)
         {
            if ( MathAbs(High[cnt]-cur_price)<4*Point || MathAbs(cur_price-Low[cnt])<4*Point ) k++;
         }
            if ( k<n5 && k>n6 && MathAbs(level1-cur_price)>q*Point && MathAbs(level2-cur_price)>q*Point
                  && MathAbs(level3-cur_price)>q*Point && MathAbs(level4-cur_price)>q*Point
                  && MathAbs(level5-cur_price)>q*Point && MathAbs(level7-cur_price)>q*Point && MathAbs(level8-cur_price)>q*Point)
                  { n6=k; level6=cur_price; }
      cur_price=cur_price-Point;
   }
   cur_price=((High[1]+Low[1])/2)+((h*Point)/2);
   for (i=0; i<=h; i++)
   {
      k=0;
      for (cnt=1; cnt<Bars; cnt++)
         {
            if ( MathAbs(High[cnt]-cur_price)<4*Point || MathAbs(cur_price-Low[cnt])<4*Point ) k++;
         }
            if ( k<n6 && k>n7 && MathAbs(level1-cur_price)>q*Point && MathAbs(level2-cur_price)>q*Point
                  && MathAbs(level3-cur_price)>q*Point && MathAbs(level4-cur_price)>q*Point
                  && MathAbs(level5-cur_price)>q*Point && MathAbs(level6-cur_price)>q*Point && MathAbs(level8-cur_price)>q*Point)
                  { n7=k; level7=cur_price; }
      cur_price=cur_price-Point;
   }
   cur_price=((High[1]+Low[1])/2)+((h*Point)/2);
   for (i=0; i<=h; i++)
   {
      k=0;
      for (cnt=1; cnt<Bars; cnt++)
         {
            if ( MathAbs(High[cnt]-cur_price)<4*Point || MathAbs(cur_price-Low[cnt])<4*Point ) k++;
         }
            if ( k<n7 && k>n8 && MathAbs(level1-cur_price)>q*Point && MathAbs(level2-cur_price)>q*Point
                  && MathAbs(level3-cur_price)>q*Point && MathAbs(level4-cur_price)>q*Point
                  && MathAbs(level5-cur_price)>q*Point && MathAbs(level6-cur_price)>q*Point && MathAbs(level7-cur_price)>q*Point)
                  { n8=k; level8=cur_price; }
       cur_price=cur_price-Point;
   }


  Comment( "K = ",k,"  n1 = ",n1,"  n2 = ",n2, "  n3 = ",n3, "  n4 = ",n4, "  n5 = ",n5, "\n",
           "level1 = ",level1,"  level5 = ",level5 ,"  cur_price = " , cur_price);

  ExtMapBuffer1[0]=level1;
  ExtMapBuffer3[0]=level2;
  ExtMapBuffer2[0]=level3;
  ExtMapBuffer4[0]=level4;
  ExtMapBuffer5[0]=level5;
  ExtMapBuffer6[0]=level6;
  ExtMapBuffer7[0]=level7;
  ExtMapBuffer8[0]=level8;

 bar=Bars;
 }
//----
   return(0);
  }
//+------------------------------------------------------------------+
Comments