DT-ZigZag-Lauer_v2
Download script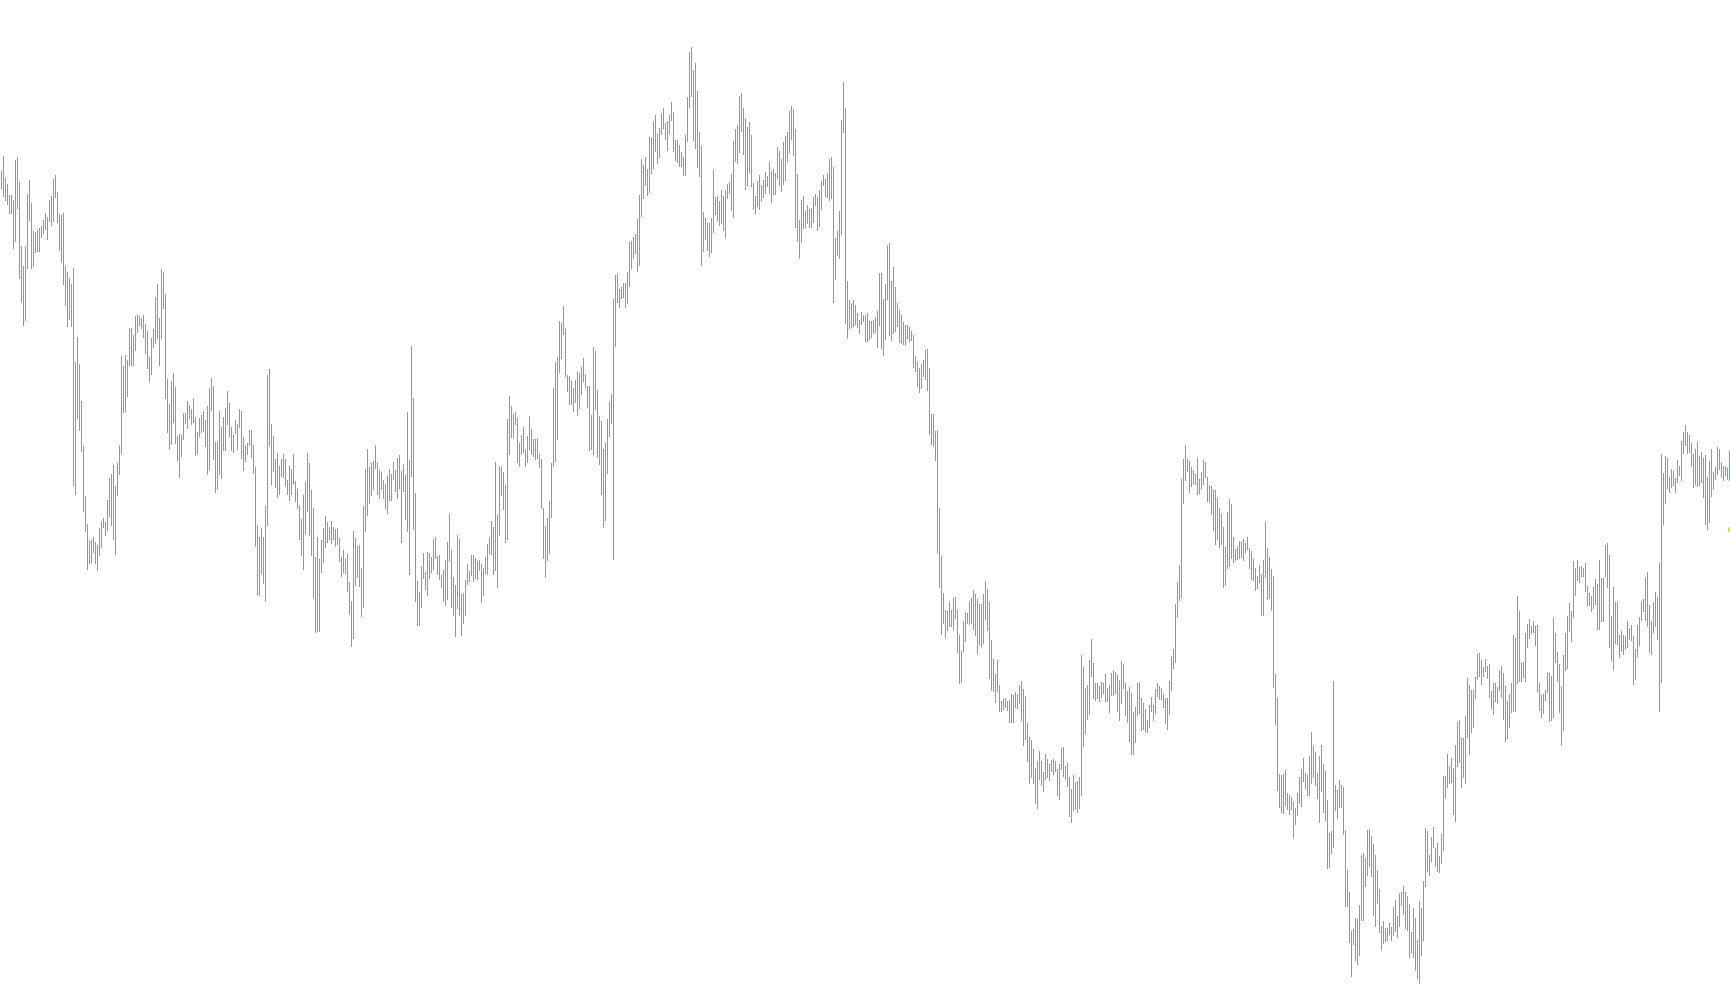
This tool is designed to analyze market trends by identifying key structural turning points. It works by integrating data from a standard "ZigZag" technical indicator with specific time-based filters to help traders visualize significant price pivots more clearly.
Core Functionality
The script scans historical price action to locate major peaks and valleys. Instead of showing every minor fluctuation, it focuses on significant movements. It identifies these points and marks them on your chart using distinct visual symbols (arrows), allowing you to see where the market momentum has shifted.
How the Logic Works
The indicator operates through three main logical steps:
1. Time and Period Alignment To ensure the data is meaningful, the script checks your current chart timeframe against a "Gross Period" setting. It is designed to work best on shorter timeframes where it can effectively look back at larger historical context. It organizes time data into an array to keep track of where specific periods begin and end.
2. Dynamic Structural Searching The heart of the script is its "search" mechanism. For every bar on your chart, the tool looks backward through history to find the most recent valid ZigZag point. Rather than just looking at the immediate neighbor, it scans a significant window of previous data to ensure it captures a true structural pivot rather than just noise.
3. Conditional Signal Filtering Once a structural point (a peak or valley) is identified, the script applies a logic check to determine how to display it:
- Bearish Context: If the current closing price is lower than or equal to the identified ZigZag point, it registers that point as a potential downward reference.
- Bullish Context: If the current closing price is higher than or equal to the identified ZigZag point, it registers it as an upward reference.
Summary for the User
By using this logic, the tool filters out the "noise" of daily price movement and highlights the underlying framework of the market. It tells you where significant structural shifts occurred based on historical pivots, providing a visual map of the trend's skeleton rather than just the constant ups and downs of the current price.
//+------------------------------------------------------------------+
//|                                              DT-ZigZag-Lauer.mq4 |
//+------------------------------------------------------------------+
#property copyright "Copyright © 2005, klot"
#property link      "klot@mail.ru"
//----
#property indicator_chart_window
#property indicator_buffers 2
#property indicator_color1 Red
#property indicator_color2 Blue
//---- input parameters
extern int       depth=5;
extern int GrossPeriod=240;
//---- buffers
double ExtMapBuffer1[];
double ExtMapBuffer2[];
datetime daytimes[];
//+------------------------------------------------------------------+
//| Custom indicator initialization function                         |
//+------------------------------------------------------------------+
int init()
  {
//---- indicators
   SetIndexStyle(0,DRAW_ARROW);
   SetIndexArrow(0,159);
   SetIndexBuffer(0,ExtMapBuffer1);
   SetIndexEmptyValue(0,0.0);
   SetIndexStyle(1,DRAW_ARROW);
   SetIndexArrow(1,159);
   SetIndexBuffer(1,ExtMapBuffer2);
   SetIndexEmptyValue(1,0.0);
//----
//----
   if (Period()>GrossPeriod) { Alert("DT-ZigZag: Òåêóùèé òàéìôðåéì äîëæåí áûòü ìåíüøå ÷åì ", GrossPeriod); return(0); }
   // Âñå Time[] ñåðèè âðåìåíè îòñîðòèðîâàíî â íàïðàâëåíèè óáûâàíèÿ
   ArrayCopySeries(daytimes,MODE_TIME,Symbol(),GrossPeriod);
   return(0);
  }
//+------------------------------------------------------------------+
//| Custor indicator deinitialization function                       |
//+------------------------------------------------------------------+
int deinit()
  {
//----
//----
   return(0);
  }
//+------------------------------------------------------------------+
//| Custom indicator iteration function                              |
//+------------------------------------------------------------------+
int start()
  {
   int    counted_bars=IndicatorCounted();
   int    limit=300,bigshift;
   double zigzag1;
   if (counted_bars<0) return(-1);
   if (counted_bars>0) counted_bars--;
   limit=Bars-counted_bars;
//----
   for(int i=0; i<limit; i++)
     {
      if(Time[i]>=daytimes[0]) bigshift=0;
      else
        {
         bigshift=ArrayBsearch(daytimes,Time[i-1],WHOLE_ARRAY,0,MODE_DESCEND);
         if(Period()<=GrossPeriod) bigshift++;
        }
      for(int cnt=bigshift; cnt<(100+bigshift); cnt++)
        {
         zigzag1=iCustom(NULL,GrossPeriod,"ZigZag",depth,5,3,0,cnt+1);
         if(zigzag1!=0)break;
        }
      if(iClose(NULL,0,i+1)<=zigzag1) ExtMapBuffer2[i]=zigzag1; else ExtMapBuffer2[i]=0.0;
      if(iClose(NULL,0,i+1)>=zigzag1)ExtMapBuffer1[i]=zigzag1; else ExtMapBuffer1[i]=0.0;
      ObjectsRedraw();
     }
   // Comment("zigzag1 = ",zigzag1);
//----
   return(0);
  }
//+------------------------------------------------------------------+
Comments