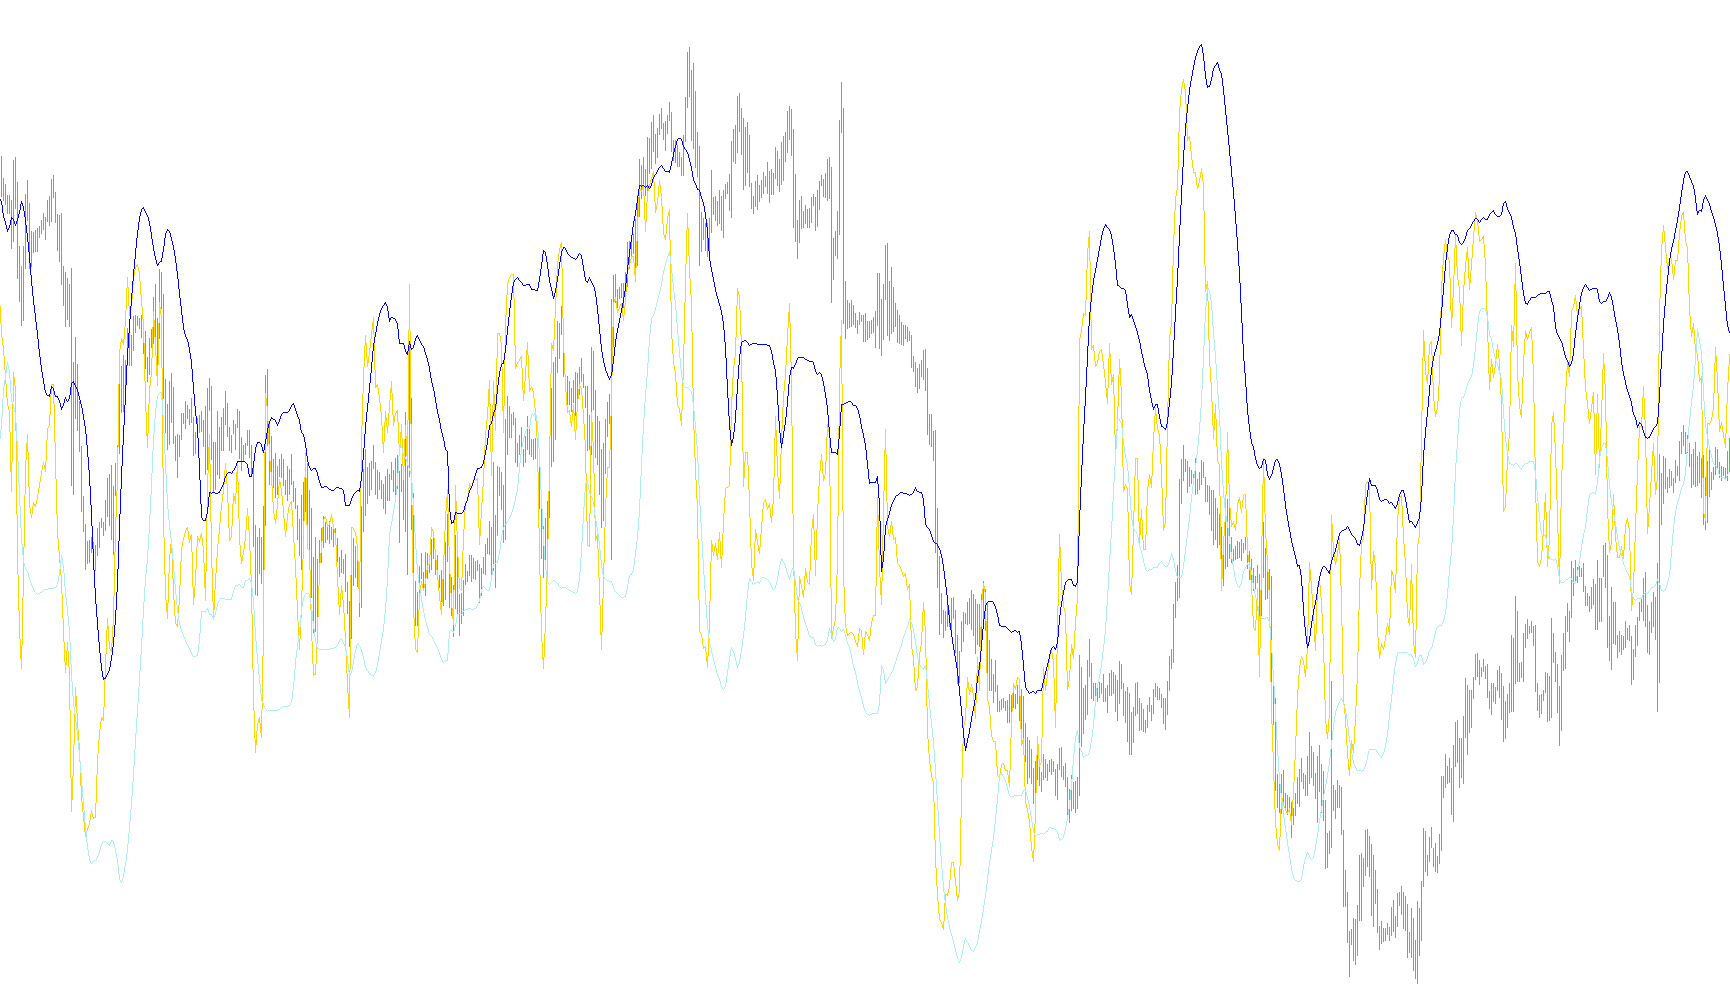
This tool is designed to provide traders with a more sophisticated way of viewing market momentum by evolving the standard Relative Strength Index (RSI) into a dynamic, volatility-adjusted visual. Instead of relying on fixed horizontal lines to determine when a market is "overbought" or "oversold," this script creates moving boundaries that adapt automatically to current market conditions.
How the Logic Works
1. Establishing the Momentum Base The foundation of the tool is the Relative Strength Index (RSI). This measures the speed and change of price movements. The script calculates this standard momentum first to understand the core direction of the market at any given moment.
2. Calculating a Dynamic Moving Average Rather than looking at the RSI value in isolation, the script takes a "look-back" at the recent history of the RSI itself. It calculates an average of these values over a specific period. This helps smooth out minor "noise" and identifies the primary trend of the momentum.
3. Measuring Market Volatility (Standard Deviation) To make the zones truly dynamic, the script calculates the market's volatility. It looks at how much the price is swinging away from its average. By calculating this variance, the tool can determine if the market is currently calm or experiencing high-intensity fluctuations.
4. Generating the Adaptive Zones The final output consists of two boundary lines (Upper and Lower Zones) that wrap around the RSI momentum:
- The Upper Zone: This is calculated by adding a specific multiplier of the volatility to the moving average. It acts as a ceiling; when the momentum pushes into this area, it suggests the market may be stretched too far in an upward direction.
- The Lower Zone: This is calculated by subtracting that same volatility from the moving average. It acts as a floor; when momentum dips into this area, it indicates a potential stretch in the downward direction.
The User Experience
Because these zones are tied to volatility, they expand during periods of high market activity and contract during quieter periods. For a trader, this means that instead of chasing static targets, you are looking at a "channel" of momentum. When the price action breaks toward or touches these dynamic boundaries, it provides a visual cue that the current move may be reaching an extreme point relative to recent history.
//+------------------------------------------------------------------+
//|                                             Dynamic Zone RSI.mq4 |
//|                                   Copyright © 2005, Pavel Kulko. |
//|                                                  polk@alba.dp.ua |
//+------------------------------------------------------------------+
#property copyright "Copyright © 2005, Pavel Kulko"
#property link      "polk@alba.dp.ua"
#property indicator_buffers 3
#property indicator_color1 Lime
#property indicator_color2 SlateBlue
#property indicator_color3 Orange

#property indicator_separate_window

extern int RSIPeriod = 14;
extern int BandPeriod = 20;

double RSIBuf[],UpZone[],DnZone[];
//+------------------------------------------------------------------+
//| Custom indicator initialization function                         |
//+------------------------------------------------------------------+
int init()
  {
//---- indicators
   SetIndexStyle(0,DRAW_LINE);
   SetIndexStyle(1,DRAW_LINE);
   SetIndexStyle(2,DRAW_LINE);
   SetIndexBuffer(0,RSIBuf);
   SetIndexBuffer(1,UpZone);
   SetIndexBuffer(2,DnZone);
//----
   return(0);
  }
//+------------------------------------------------------------------+
//| Custor indicator deinitialization function                       |
//+------------------------------------------------------------------+
int deinit()
  {
//----

//----
   return(0);
  }
//+------------------------------------------------------------------+
//| Custom indicator iteration function                              |
//+------------------------------------------------------------------+
int start()
  {
   double MA, RSI[];
   ArrayResize(RSI,BandPeriod);
   int counted_bars=IndicatorCounted();
   int limit = Bars-counted_bars-1;
   for(int i=limit; i>=0; i--)
   {
      RSIBuf[i] = iRSI(NULL,0,RSIPeriod,PRICE_WEIGHTED,i);
      MA = 0;
      for(int j=i; j<i+BandPeriod; j++) {
         RSI[j-i] = RSIBuf[j];
         MA += RSIBuf[j]/BandPeriod;
      }
      UpZone[i] = MA + (1.3185 * StDev(RSI,BandPeriod));
      DnZone[i] = MA - (1.3185 * StDev(RSI,BandPeriod));
   }

//----
   return(0);
  }

double StDev(double& Data[], int Per)
{
  return(MathSqrt(Variance(Data,Per)));
}

double Variance(double& Data[], int Per)
{
  double sum, ssum;
  for (int i=0; i<Per; i++)
  {
    sum += Data[i];
    ssum += MathPow(Data[i],2);
  }
  return((ssum*Per - sum*sum)/(Per*(Per-1)));
}
//+------------------------------------------------------------------+
Comments