IND_Inverse_and_BB_and_EMA
Download script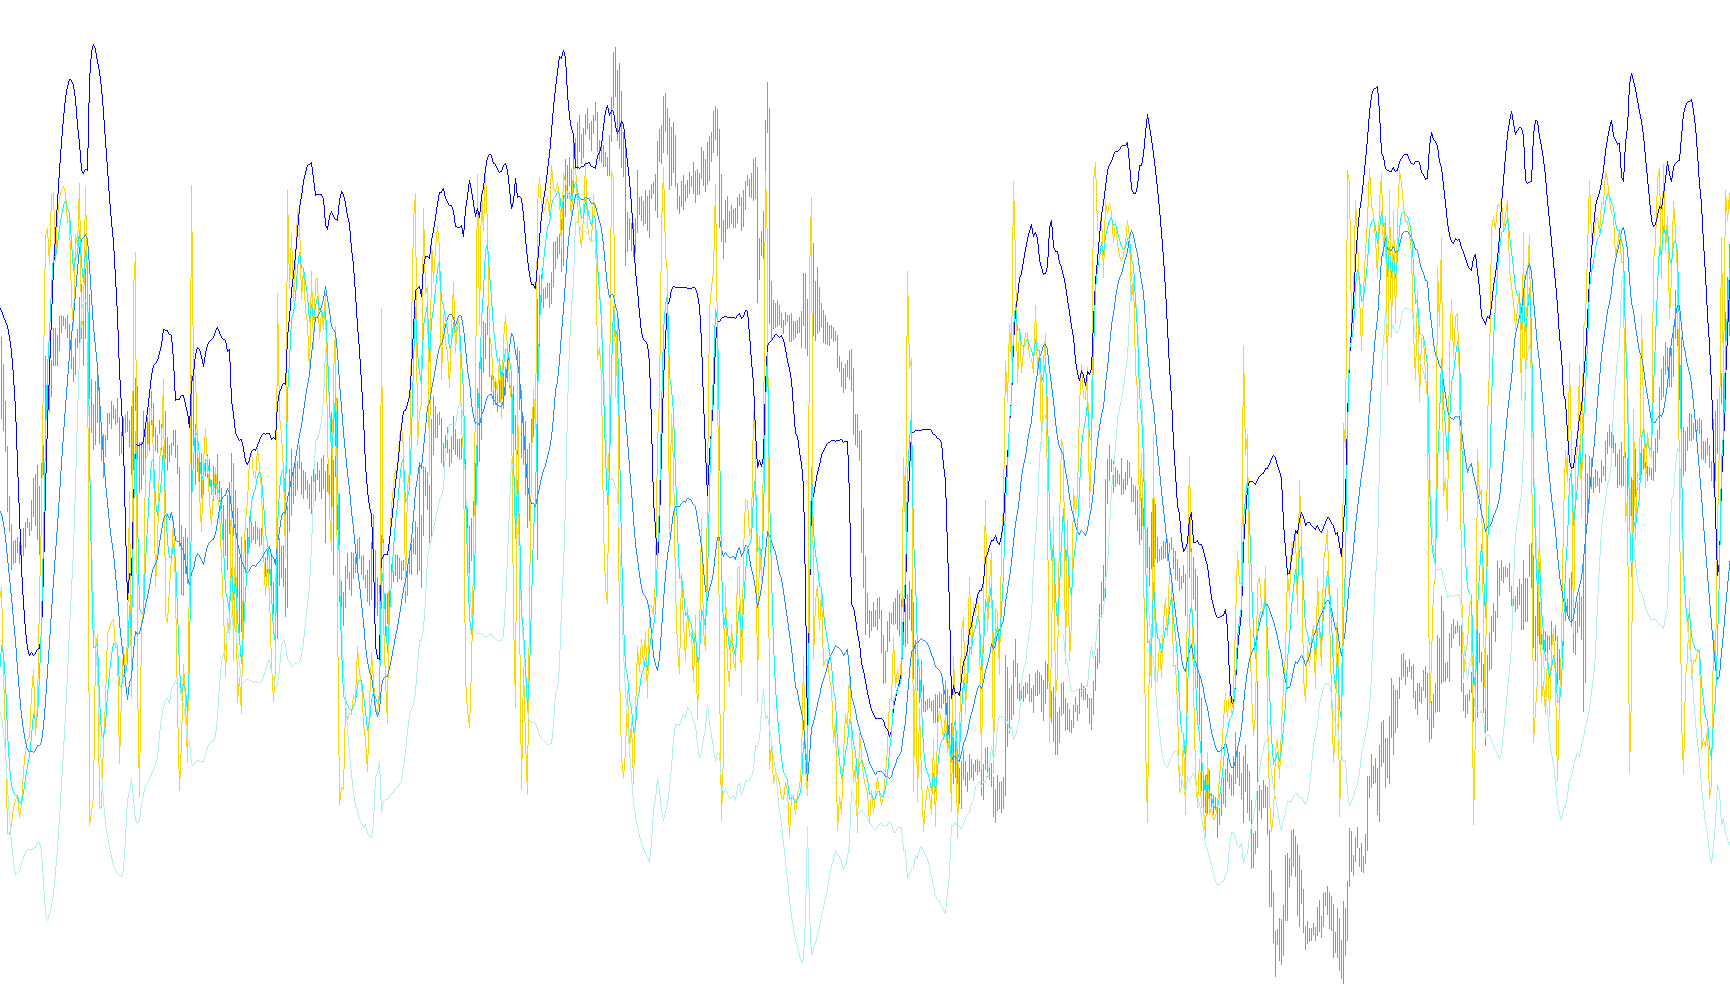
This tool is a custom technical analysis indicator designed to help traders visualize price momentum and identify potential trend reversals by combining several different mathematical layers. Instead of looking at the raw price alone, it processes data through three distinct stages: positioning, volatility, and smoothing.
Core Logic Breakdown
1. Relative Price Positioning (The Foundation) The script first determines where the current price sits within its recent price range. It identifies the highest high and the lowest low over a specific lookback period to establish an "amplitude." By calculating where the closing price falls between these two extremes, it creates a normalized value. This allows the tool to see how "stretched" or "compressed" the price is relative to its recent history, regardless of the actual currency value.
2. Volatility Bands (The Boundaries) Once the primary data is established, the script calculates a moving average and measures the statistical variance (volatility) of that data. It then projects two dynamic boundaries:
- Upper Zone: Represents an upper limit based on high-volatility movements.
- Lower Zone: Represents a lower limit based on low-volatility movements.
These bands act as "envelopes." When the primary indicator moves toward or outside these zones, it suggests that the market may be reaching an overextended state, potentially signaling a cooling-off period or a trend exhaustion point.
3. Trend Smoothing (The Signal) To ensure the visual data is easy to read and isn't distracted by "market noise," the script applies an Exponential Moving Average (EMA). This smooths out the underlying data points, making it easier for a visitor to identify the primary direction of the trend at a glance.
How it works in practice
By combining these three elements, the indicator provides a multi-layered view of the market:
- The Centerline shows the general momentum.
- The Bands show the extremes of price volatility, helping to identify when the market is "overbought" or "oversold."
- The EMA helps filter out minor price fluctuations to show the larger underlying trend.
Essentially, this tool is designed to help a trader see not just where the price is going, but how fast it is moving and whether it is approaching a point where a reversal might occur.
//+------------------------------------------------------------------+
//|                                   IND Inverse and BB and EMA.mq4 |
//+------------------------------------------------------------------+
#property copyright "Copyright © 2006, ..."
// modified by ALeX
#property link      "http://www.forex-tsd.com/"

#property indicator_separate_window
#property indicator_buffers 5
#property indicator_color1 Silver
#property indicator_color2 Orange
#property indicator_color3 Orange
#property indicator_color4 Red
#property indicator_color5 Aqua

//---- input parameters
extern int RSIPeriod = 14;
extern int BandPeriod = 20;
extern int EMA_val = 5;
extern double SD_Coeff = 1.3185;

//---- buffers
double Buffer[];
double UpZone[],DnZone[];
double bufMA[], bufEMA[];

extern int iPeriod = 1;

//----
//+------------------------------------------------------------------+
//| Init                                                             |
//+------------------------------------------------------------------+
int init()
{
//---- indicators
//    IndicatorDigits(Digits+2);
    SetIndexStyle(0,DRAW_LINE);
    SetIndexBuffer(0,Buffer);

   SetIndexStyle(1,DRAW_LINE);
   SetIndexStyle(2,DRAW_LINE);
   SetIndexStyle(3,DRAW_LINE);
   SetIndexStyle(4,DRAW_LINE);
   SetIndexBuffer(1,UpZone);
   SetIndexBuffer(2,DnZone);
   SetIndexBuffer(3,bufMA);
   SetIndexBuffer(4,bufEMA);

//----
    return(0);
}

//+------------------------------------------------------------------+
//| Parabolic Sell And Reverse system                                |
//+------------------------------------------------------------------+
int start()
  {
   int limit, i;
   int counted_bars=IndicatorCounted();
   double HD, LD, amplitude;

   double MA, RSI[];
   ArrayResize(RSI,BandPeriod);

//---- check for possible errors
   if(counted_bars<0)
   {
      return(-1);
   }
//---- last counted bar will be recounted
   if(counted_bars > 0)
     counted_bars--;
   limit=Bars-counted_bars;

//---- do it


    for (i=limit-1; i>=0; i--)
    {
        // Easy to read
        HD = High[Highest(NULL,0,MODE_HIGH,(iPeriod* 20),i)];
        LD = Low[Lowest(NULL,0,MODE_LOW,(iPeriod* 20),i)];
        amplitude = HD - LD;
        Buffer[i]= ((Close[i]-(HD-(amplitude/2)))/amplitude) * iPeriod;


//      RSIBuf[i] = iRSI(NULL,0,RSIPeriod,PRICE_WEIGHTED,i);
      MA = 0;
      for(int j=i; j<i+BandPeriod; j++) {
         RSI[j-i] = Buffer[j];
         MA += Buffer[j]/BandPeriod;
      }
      UpZone[i] = MA + (SD_Coeff * StDev(RSI,BandPeriod));
      DnZone[i] = MA - (SD_Coeff * StDev(RSI,BandPeriod));
      bufMA[i] = MA;
    }

    for (i=limit-1-EMA_val; i>=0; i--)
      bufEMA[i] = iMAOnArray (Buffer,0,EMA_val,0,MODE_EMA,i);

//----
   return(0);
  }
//+------------------------------------------------------------------+

double StDev(double& Data[], int Per)
{
  return(MathSqrt(Variance(Data,Per)));
}

double Variance(double& Data[], int Per)
{
  double sum, ssum;
  for (int i=0; i<Per; i++)
  {
    sum += Data[i];
    ssum += MathPow(Data[i],2);
  }
  return((ssum*Per - sum*sum)/(Per*(Per-1)));
}
Comments