DynamicZoneRSI_001
Download script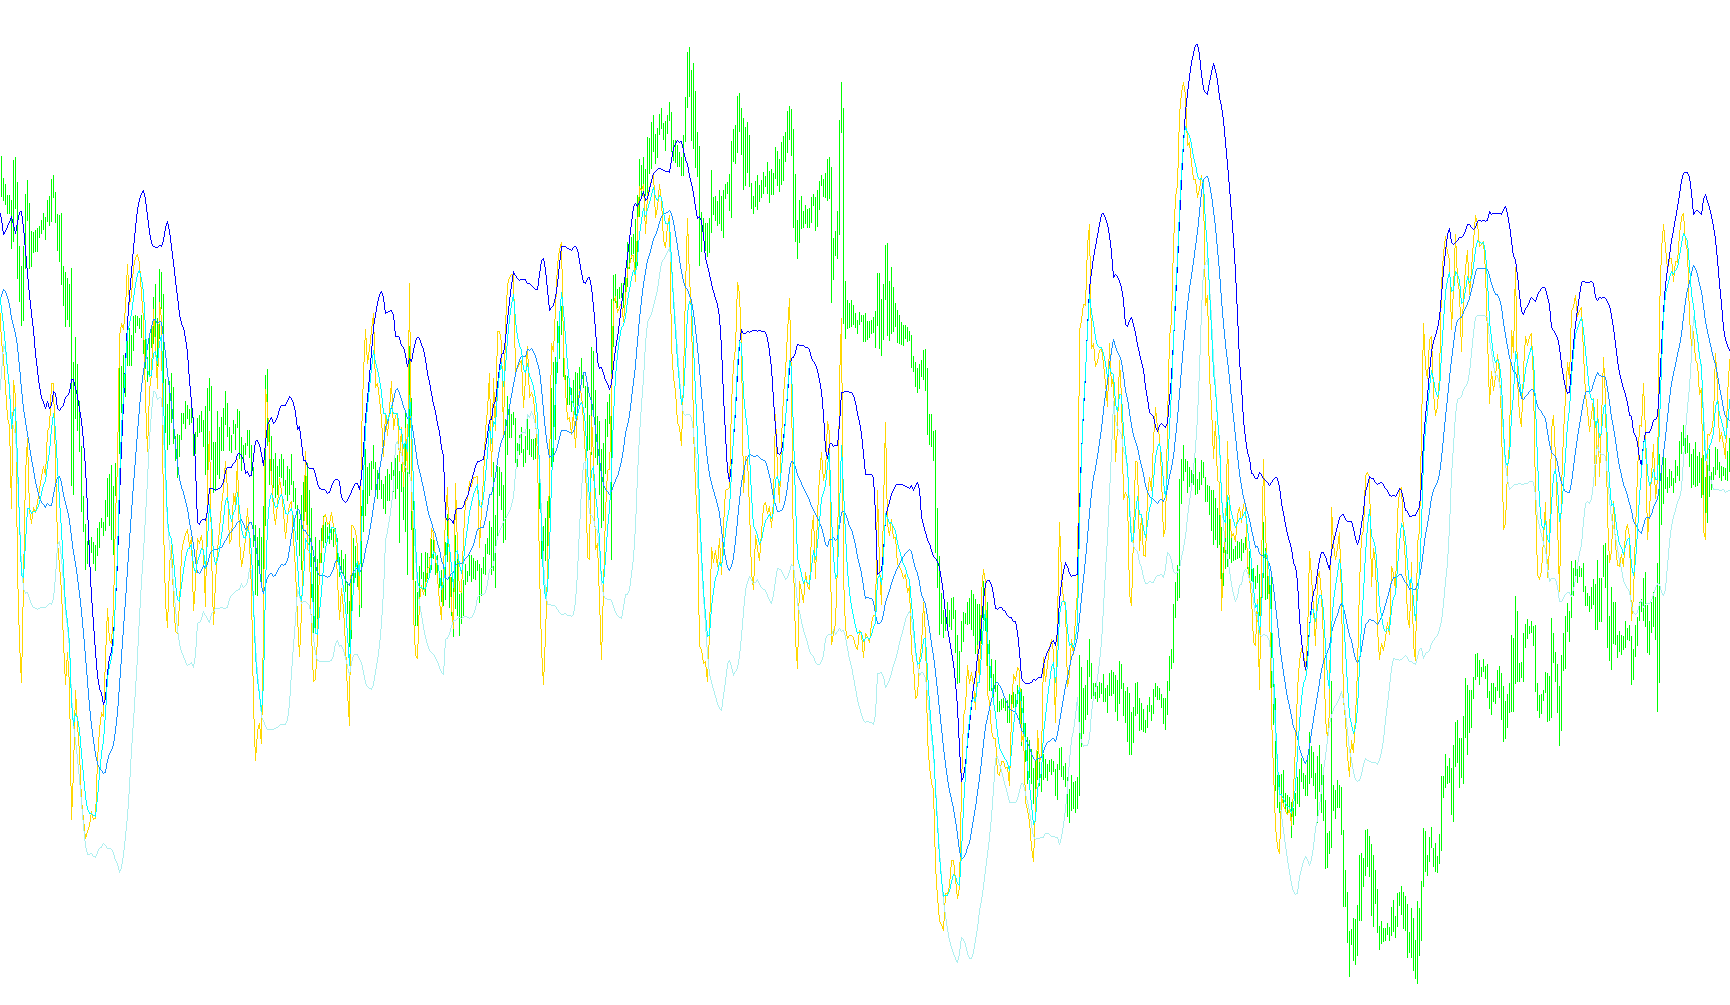
This technical indicator is designed to provide a more nuanced view of market momentum by layering multiple mathematical filters onto the Relative Strength Index (RSI). Rather than simply looking at whether the RSI is "overbought" or "oversold" based on fixed levels, this script creates a dynamic environment that adjusts to current market volatility.
Core Components and Logic
1. The Base Momentum (RSI) At its foundation, the script tracks the Relative Strength Index (RSI). This tells you how quickly the price is moving up or down relative to its recent history. However, instead of viewing this as a standalone figure, the script uses it as the raw data for further calculations.
2. Dynamic Volatility Bands (Bollinger-style logic) The script takes the RSI data and calculates a "Moving Average" of that RSI. It then measures the volatility (Standard Deviation) of the RSI over a specific period. Using this, it constructs two dynamic boundaries:
- Upper Zone: A ceiling that expands when the market is volatile and contracts when it is calm.
- Lower Zone: A floor that mirrors the upper zone. By calculating these zones based on the RSI's own behavior, the indicator helps identify when the momentum is reaching extreme territory relative to its recent trend.
3. Trend Smoothing (EMA) To filter out "market noise" and focus on the primary direction, the script incorporates an Exponential Moving Average (EMA). This helps a user see the underlying trend of the RSI more clearly, prioritizing recent price action over older data.
How it Works Together
The logic follows a multi-step process for every price candle:
- Capture Momentum: It first calculates the RSI to determine current strength.
- Analyze Volatility: It looks back at a set number of previous candles to determine how much that momentum is fluctuating.
- Draw Boundaries: It plots the upper and lower zones based on that fluctuation, creating a "channel" for the RSI.
- Smooth the Trend: It overlays an EMA to show the average direction of the momentum.
Summary for the Trader
Instead of relying on static lines (like 70 or 30), this tool creates a "breathing" channel. It allows you to see not just where the price is, but how much it is deviating from its recent normal behavior. When the RSI moves toward or outside these dynamic zones, it suggests that the current momentum may be stretched, potentially signaling a period of exhaustion or a shift in trend.
//+------------------------------------------------------------------+
//|                                             Dynamic Zone RSI.mq4 |
//|                                Copyright © 2005-07, Pavel Kulko. |
//|                                                  polk@alba.dp.ua |
//+------------------------------------------------------------------+
#property copyright "Copyright © 2005-07, Pavel Kulko"
#property link      "polk@alba.dp.ua"
#property indicator_buffers 5
#property indicator_color1 Lime //RSI
#property indicator_color2 DarkGray //upper band
#property indicator_color3 DimGray //lower band
#property indicator_color4 Red // BB median line
#property indicator_color5 Blue // EMA

#property indicator_separate_window

extern int RSIPeriod = 13;
extern int BandPeriod = 18;
extern int EMAPeriod = 5;

double RSIBuf[],UpZone[],DnZone[];
double bufMA[], bufEMA[];

//+------------------------------------------------------------------+
//| Custom indicator initialization function                         |
//+------------------------------------------------------------------+
int init()
  {
//---- indicators
   SetIndexStyle(0,DRAW_LINE);
   SetIndexStyle(1,DRAW_LINE);
   SetIndexStyle(2,DRAW_LINE);
   SetIndexStyle(3,DRAW_LINE);
   SetIndexStyle(4,DRAW_LINE);
   SetIndexBuffer(0,RSIBuf);
   SetIndexBuffer(1,UpZone);
   SetIndexBuffer(2,DnZone);
   SetIndexBuffer(3,bufMA);
   SetIndexBuffer(4,bufEMA);
//---- name for DataWindow and indicator subwindow label
   IndicatorShortName("Dynamic Zone RSI("+RSIPeriod+") BB("+BandPeriod+") EMA("+EMAPeriod+") values: ");
//----
   return(0);
  }
//+------------------------------------------------------------------+
//| Custor indicator deinitialization function                       |
//+------------------------------------------------------------------+
int deinit()
  {
//----

//----
   return(0);
  }
//+------------------------------------------------------------------+
//| Custom indicator iteration function                              |
//+------------------------------------------------------------------+
int start()
  {
   double MA, RSI[];
   ArrayResize(RSI,BandPeriod);
   int counted_bars=IndicatorCounted();
   int limit = Bars-counted_bars-1;
   for(int i=limit; i>=0; i--)
   {
      RSIBuf[i] = iRSI(NULL,0,RSIPeriod,PRICE_WEIGHTED,i);
      MA = 0;
      for(int j=i; j<i+BandPeriod; j++) {
         RSI[j-i] = RSIBuf[j];
         MA += RSIBuf[j]/BandPeriod;
      }
      UpZone[i] = MA + (1.3185 * StDev(RSI,BandPeriod));
      DnZone[i] = MA - (1.3185 * StDev(RSI,BandPeriod));
      bufMA[i] = MA;
   }

    for (i=limit-1-EMAPeriod; i>=0; i--)
    bufEMA[i] = iMAOnArray (RSIBuf,0,EMAPeriod,0,MODE_EMA,i);
//----
   return(0);
  }

double StDev(double& Data[], int Per)
{
  return(MathSqrt(Variance(Data,Per)));
}

double Variance(double& Data[], int Per)
{
  double sum, ssum;
  for (int i=0; i<Per; i++)
  {
    sum += Data[i];
    ssum += MathPow(Data[i],2);
  }
  return((ssum*Per - sum*sum)/(Per*(Per-1)));
}
//+------------------------------------------------------------------+
Comments