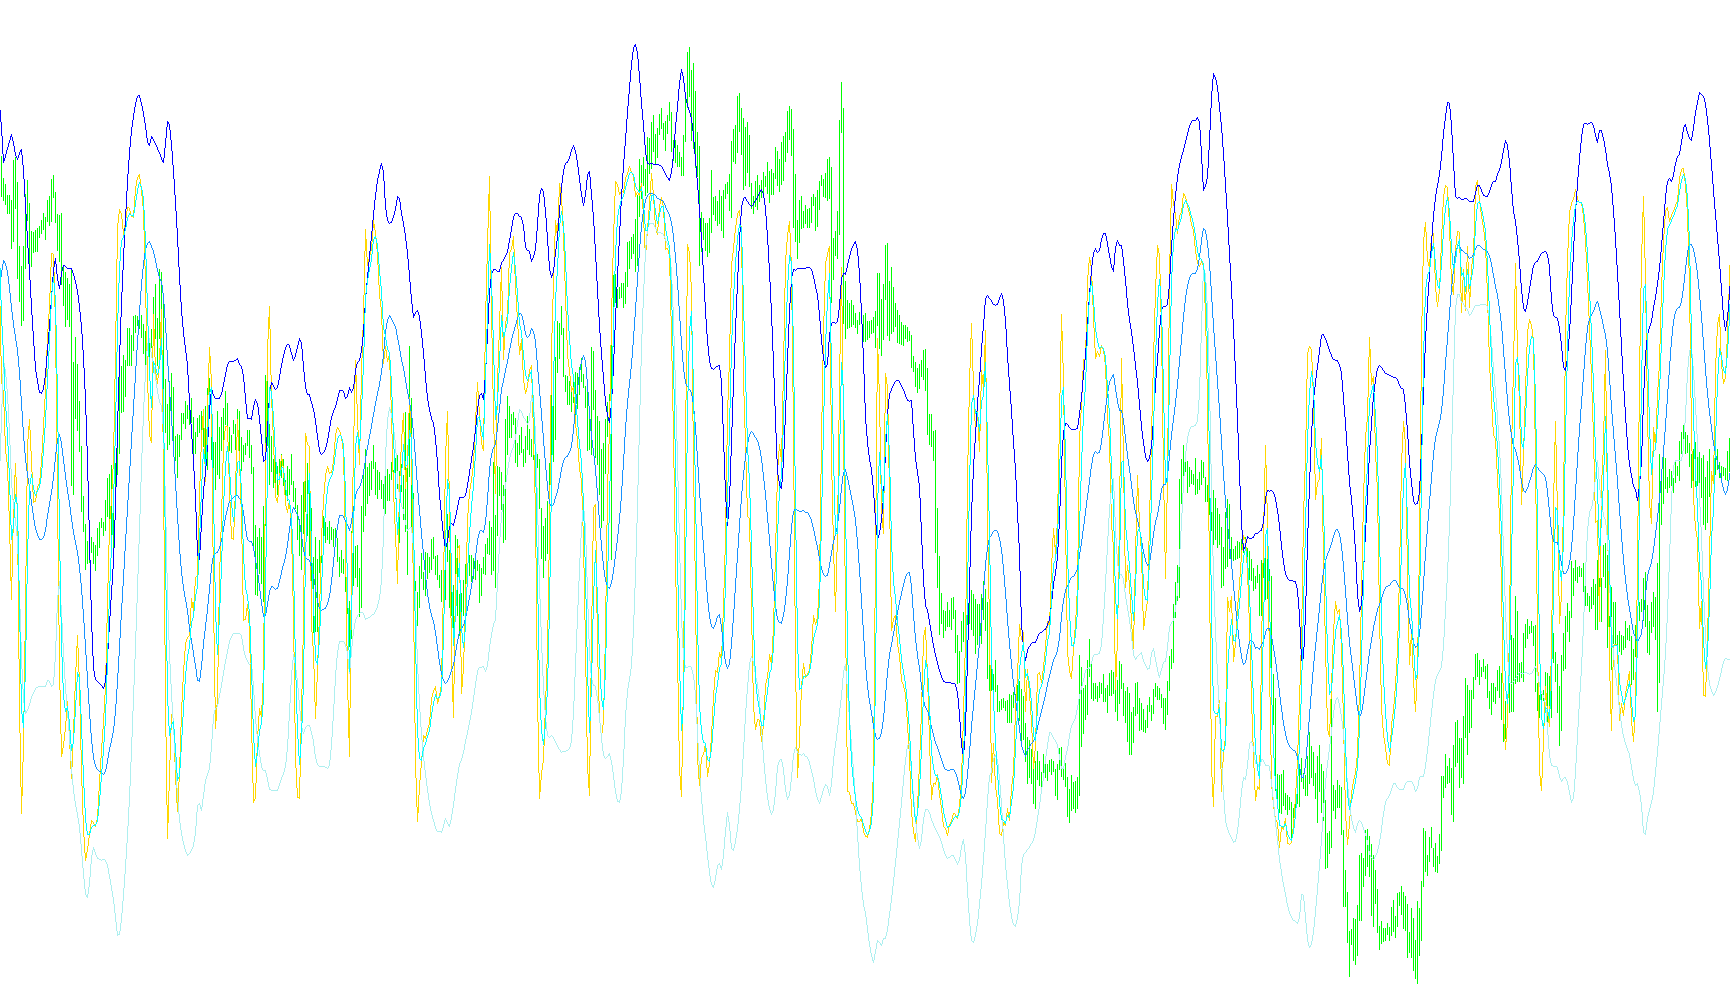
This script is a specialized technical analysis tool designed to provide traders with a multi-layered view of market momentum and volatility. Rather than relying on a single indicator, it combines three distinct mathematical concepts—Stochastic Oscillators, Bollinger Bands, and Exponential Moving Averages—into one cohesive visual display.
Core Logic and Functionality
The primary objective of this tool is to analyze the "momentum" of the price action while simultaneously defining specific zones where the market may be overextended or stabilizing.
1. Momentum Tracking (Stochastic Component) At its foundation, the script tracks the Stochastic Oscillator. This identifies whether a currency or asset is currently in a state of overbought or oversold conditions. It looks at the relative position of recent price prices compared to their price range over a specific period, helping users see the "speed" and "strength" of the current trend.
2. Dynamic Volatility Zones (Bollinger Band Overlay) One of the unique features of this script is that it applies Bollinger Bands directly onto the Stochastic data rather than the raw price chart.
- The Median Line: This acts as a baseline for the momentum.
- Upper and Lower Bands: By calculating the standard deviation of the Stochastic values, the script creates dynamic "envelopes." These bands expand when the market is volatile and contract when it is stable.
- The Purpose: This allows traders to see if the current momentum is deviating significantly from its recent average. If the momentum line pushes outside these dynamic bands, it can signal an extreme move that might be due for a correction.
3. Trend Smoothing (Exponential Moving Average) To filter out "noise" and provide a clearer picture of the immediate trend, the script incorporates an Exponential Moving Average (EMA). Unlike a simple average, this calculation gives more weight to the most recent data points. This helps the user identify the prevailing direction of the momentum with less lag than traditional methods.
How it Works Together
Instead of looking at price candles alone, this script allows you to watch the "rhythm" of the market in a separate window:
- It tells you where the price is going (via the Stochastic movement).
- It tells you how fast/volatile that move is (via the Bollinger Bands).
- It tells you the smoothed trend direction (via the EMA).
By combining these elements, the script helps identify high-probability trading zones where momentum is reaching an extreme point relative to its historical volatility.
//+------------------------------------------------------------------+
//|                                           Dynamic Zone Stoch.mq4 |
//+------------------------------------------------------------------+
//+------------------------------------------------------------------+
//|                                             Dynamic Zone RSI.mq4 |
//|                                Copyright © 2005-07, Pavel Kulko. |
//|                                                  polk@alba.dp.ua |
//+------------------------------------------------------------------+
#property copyright "Copyright © 2005-07, Pavel Kulko"
#property link      "polk@alba.dp.ua"

#property indicator_separate_window
#property indicator_buffers 5
#property indicator_color1 Lime //Stoch K% line
//#property indicator_color2 DarkGreen //Stoch D% line
#property indicator_color2 DarkGray //upper band
#property indicator_color3 DimGray //lower band
#property indicator_color4 Red // BB median line
#property indicator_color5 Blue //EMA

extern string note1 = "Stochastic";
extern int StochPeriod = 14;
extern int DPeriod = 3;
extern int Slowing = 3;
extern bool DrawStochastic = true;
extern string note2 = "Bollinger Band";
extern int BandPeriod = 18;
extern bool DrawBollingerBand = true;
extern string note3 = "Exponential Moving Average";
extern int EMAPeriod = 3;
extern bool DrawEMA = true;

double StochK[],StochD[],BBUpperBand[],BBLowerBand[], BBMedianLine[], ExpMA[];
//+------------------------------------------------------------------+
int init()
  {
   IndicatorBuffers(5);
   if (DrawStochastic) {
      SetIndexStyle(0,DRAW_LINE);
      SetIndexBuffer(0,StochK);
   }
//   SetIndexStyle(1,DRAW_LINE);
//   SetIndexBuffer(1,StochD);
   if (DrawBollingerBand) {
      SetIndexStyle(1,DRAW_LINE);
      SetIndexBuffer(1,BBUpperBand);
      SetIndexStyle(2,DRAW_LINE);
      SetIndexBuffer(2,BBLowerBand);
      SetIndexStyle(3,DRAW_LINE);
      SetIndexBuffer(3,BBMedianLine);
   }
   if (DrawEMA) {
      SetIndexStyle(4,DRAW_LINE);
      SetIndexBuffer(4,ExpMA);
   }
   IndicatorShortName("Dynamic Zone Stoch("+StochPeriod+","+DPeriod+","+Slowing+") BB("+BandPeriod+") EMA("+EMAPeriod+") values: ");
   return(0);
  }
//+------------------------------------------------------------------+
int deinit()
  {
   return(0);
  }
//+------------------------------------------------------------------+
double Variance(double& Data[], int Per)
{
  double sum, ssum;
  for (int i=0; i<Per; i++)
  {
    sum += Data[i];
    ssum += MathPow(Data[i],2);
  }
  return((ssum*Per - sum*sum)/(Per*(Per-1)));
}

double StDev(double& Data[], int Per)
{
  return(MathSqrt(Variance(Data,Per)));
}
//+------------------------------------------------------------------+
int start()
  {
   double MA, Stoch[];
   ArrayResize(Stoch,BandPeriod);
   int i, counted_bars=IndicatorCounted();
   int limit = Bars-counted_bars-1;

   for(i=limit; i>=0; i--)
   {
      StochK[i] = iStochastic(NULL,0,StochPeriod,DPeriod,Slowing,MODE_SMA,0,MODE_MAIN,i);
//      StochD[i] = iStochastic(NULL,0,StochPeriod,DPeriod,Slowing,MODE_SMA,0,MODE_SIGNAL,i);
      MA = 0;
      for(int j=i; j<i+BandPeriod; j++) {
         Stoch[j-i] = StochK[j];
         MA += StochK[j]/BandPeriod;
      }
      BBUpperBand[i] = MA + (1.3185 * StDev(Stoch,BandPeriod));
      BBLowerBand[i] = MA - (1.3185 * StDev(Stoch,BandPeriod));
      BBMedianLine[i] = MA;
   }
   for(i=limit; i>=0; i--) {
      ExpMA[i] = iMAOnArray (StochK,0,EMAPeriod,0,MODE_EMA,i); }
   return(0);
  }
//+------------------------------------------------------------------+
Comments