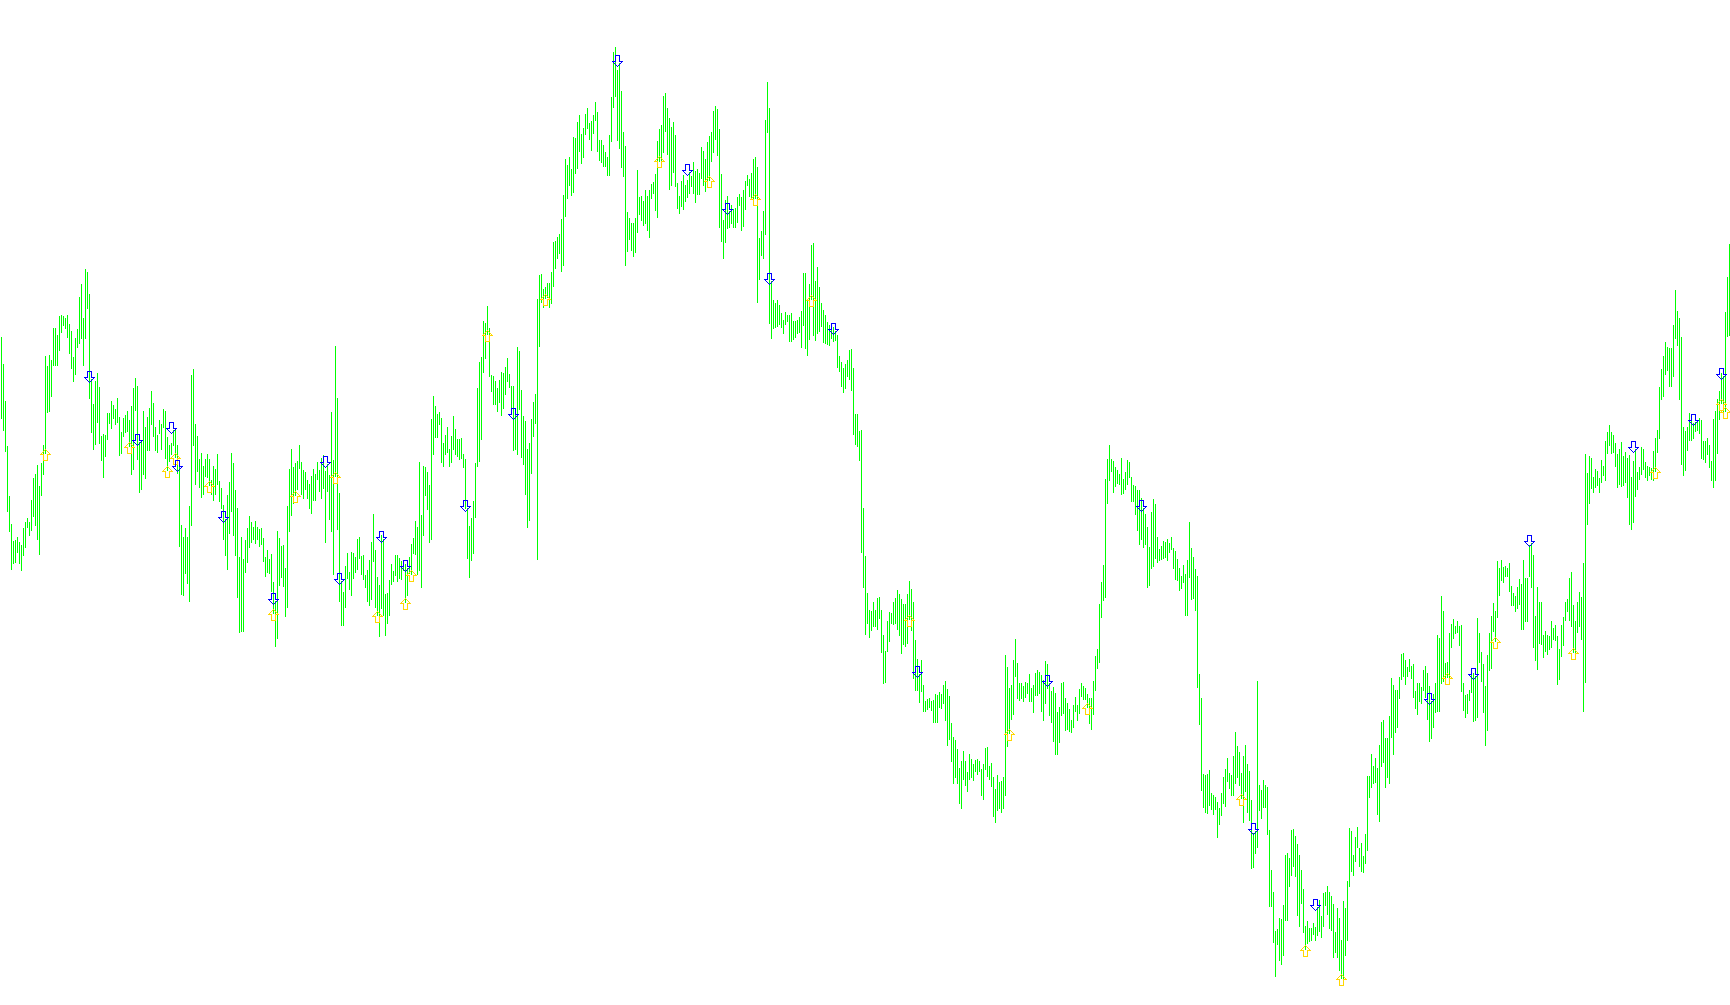
This indicator is designed to help traders identify potential momentum shifts in the market by analyzing the relationship between two moving averages. It simplifies complex price action into clear visual signals, allowing you to spot where the trend might be changing direction.
How the Logic Works
The tool operates by comparing a "Fast" moving average against a "Slow" moving average. Think of these as two different filters for price data: one reacts quickly to recent changes, while the other provides a smoother view of the long-term trend.
The script continuously monitors the position of these two lines relative to each other. It specifically looks for "crossovers"—the exact moment when the faster line crosses over the slower line.
Signal Generation
Rather than drawing continuous lines that can clutter your screen, this tool translates crossovers into specific visual markers:
- Bullish Signals (Blue Arrows): When the Fast moving average moves from below to above the Slow moving average, the script identifies a potential upward shift in momentum. It places a blue arrow slightly below the current price candle to signal a possible buying opportunity or an increase in bullish strength.
- Bearish Signals (Red Arrows): Conversely, when the Fast moving average moves from above to below the Slow moving average, the script detects a downward shift. It places a red arrow slightly above the current price candle to signal a potential selling opportunity or a decrease in bullish strength.
Customization Options
To ensure the tool fits your specific trading style, the logic includes several adjustable parameters:
- Time Periods: You can define how many past candles are used to calculate the "Fast" and "Slow" averages. Shorter periods make the tool more reactive to sudden price jumps, while longer periods filter out minor market noise.
- Calculation Methods: You can choose different mathematical models for the averages (such as Simple, Exponential, or Smoothed Moving Averages), depending on how heavily you want the most recent price data to influence the result.
- Price Sources: You can instruct the tool to base its calculations on various types of price data, such as the opening price, closing price, highs, lows, or weighted averages of the candles.
//+------------------------------------------------------------------+
//|                                                     ind_Test.mq4 |
//|                                                                * |
//|                                                                * |
//+------------------------------------------------------------------+
#property copyright "Integer"
#property link      "for-good-letters@yandex.ru"

#property indicator_chart_window
#property indicator_buffers 2
#property indicator_color1 Blue
#property indicator_color2 Red
//---- input parameters
extern int FastMAPeriod=13; // ïåðèîä áûñòðîé ÌÀ
extern int FastMAMethod=0; // ìåòîä áûñòðîé ÌÀ: öåíà áûñòðîé ÌÀ: 0-SMA, 1-EMA, 2-SMMA, 4-LWMA
extern int FastMAPrice=0; // öåíà áûñòðîé ÌÀ: 0-Close, 1-Open, 2-High, 3-Low, 4-Median, 5-Typical, 6-Weighted
extern int SlowMAPeriod=21; // ïåðèîä ìåäëåííîé ÌÀ
extern int SlowMAMethod=0; // ìåòîä ìåäëåííîé ÌÀ: 0-SMA, 1-EMA, 2-SMMA, 4-LWMA
extern int SlowMAPrice=0; // öåíà ìåäëåííîé ÌÀ: 0-Close, 1-Open, 2-High, 3-Low, 4-Median, 5-Typical, 6-Weighted


//---- buffers
double ExtMapBuffer1[];
double ExtMapBuffer2[];
//+------------------------------------------------------------------+
//| Custom indicator initialization function                         |
//+------------------------------------------------------------------+
int init()
  {
//---- indicators
   SetIndexStyle(0,DRAW_ARROW);
   SetIndexArrow(0,241);
   SetIndexBuffer(0,ExtMapBuffer1);
   SetIndexEmptyValue(0,0.0);
   SetIndexStyle(1,DRAW_ARROW);
   SetIndexArrow(1,242);
   SetIndexBuffer(1,ExtMapBuffer2);
   SetIndexEmptyValue(1,0.0);
//----
   return(0);
  }
//+------------------------------------------------------------------+
//| Custom indicator deinitialization function                       |
//+------------------------------------------------------------------+
int deinit()
  {
//----

//----
   return(0);
  }
//+------------------------------------------------------------------+
//| Custom indicator iteration function                              |
//+------------------------------------------------------------------+
int start()
  {
   int limit=Bars-IndicatorCounted();

      for(int i=limit-1;i>=0;i--){
         double fast_ma_1=iMA(NULL,0,FastMAPeriod,0,FastMAMethod,FastMAPrice,i);
         double slow_ma_1=iMA(NULL,0,SlowMAPeriod,0,SlowMAMethod,SlowMAPrice,i);
         double fast_ma_2=iMA(NULL,0,FastMAPeriod,0,FastMAMethod,FastMAPrice,i+1);
         double slow_ma_2=iMA(NULL,0,SlowMAPeriod,0,SlowMAMethod,SlowMAPrice,i+1);

            if(fast_ma_1>slow_ma_1 && !(fast_ma_2>slow_ma_2)){
               ExtMapBuffer1[i]=Low[i]-Point*5;
            }
            if(fast_ma_1<slow_ma_1 && !(fast_ma_2<slow_ma_2)){
               ExtMapBuffer2[i]=High[i]+Point*5;
            }


      }

//----

//----
   return(0);
  }
//+------------------------------------------------------------------+
Comments