EmilioSuperBands
Download script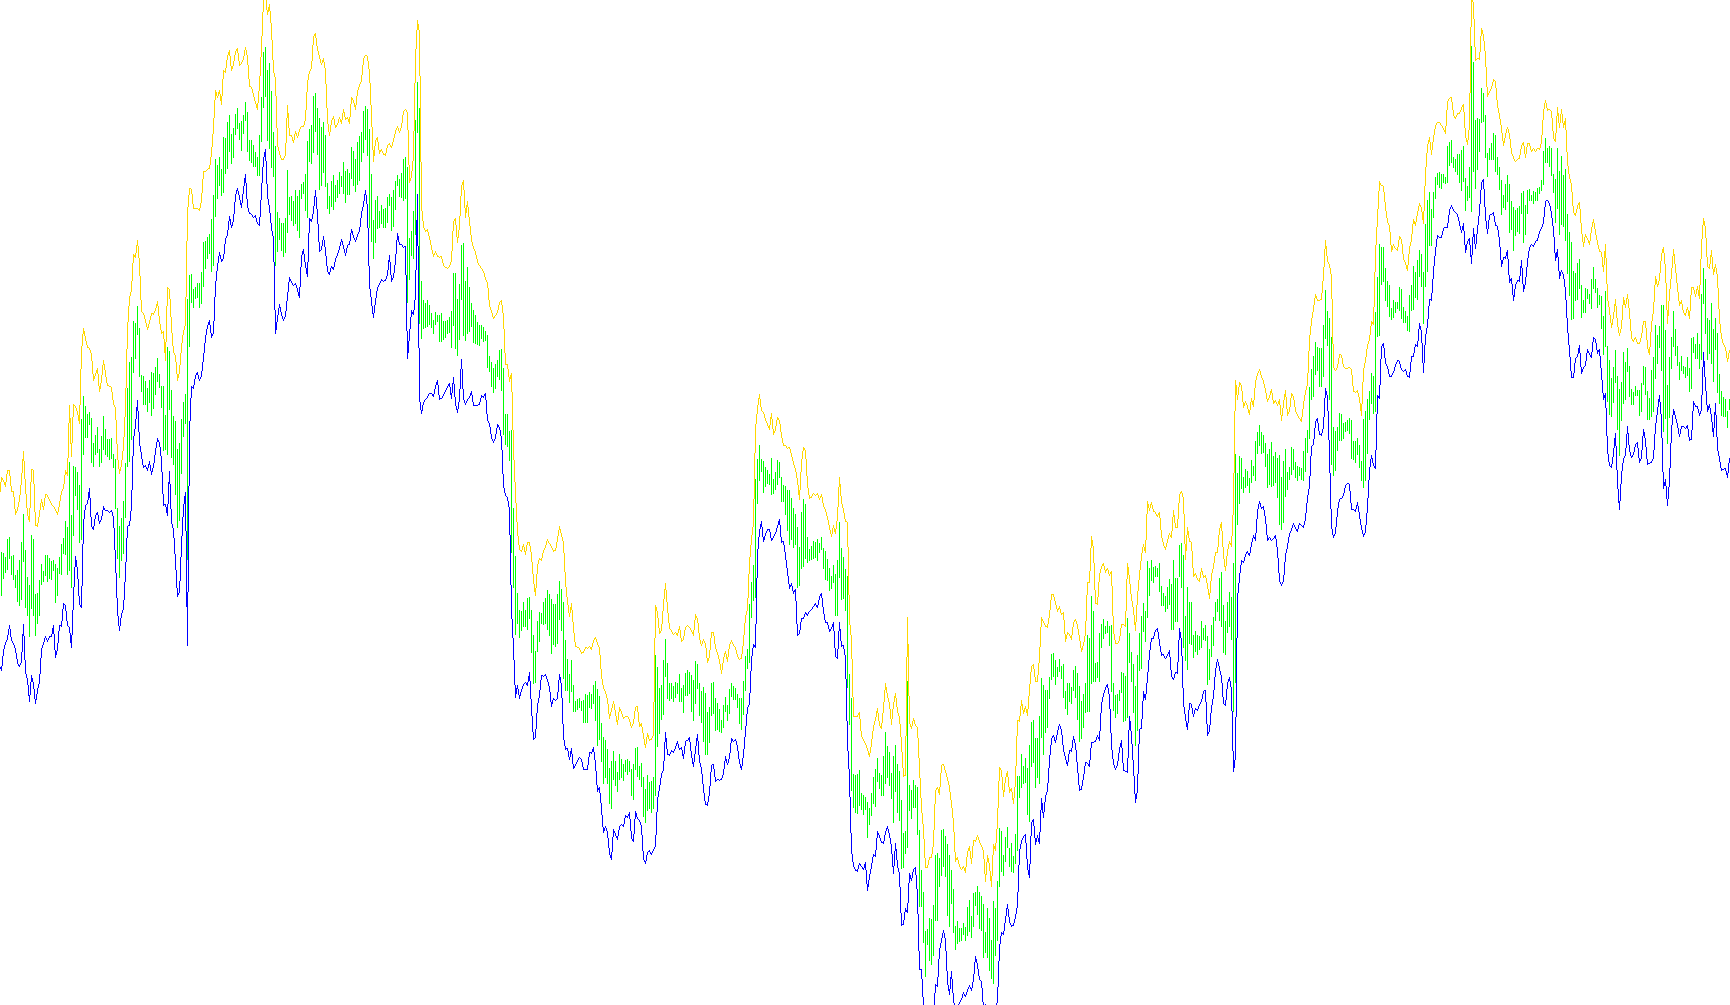
This indicator is designed to provide traders with a visual representation of market volatility and potential price boundaries. Instead of simply plotting moving averages of the price itself, it analyzes the "range" of the market to create dynamic support and resistance levels.
Core Logic and Mechanics
1. Volatility Measurement (The Foundation) The tool begins by calculating the distance between the highest and lowest points of each price candle. Specifically, it looks at how far the price moved during a specific period, taking into account both the current candle's range and the previous closing price. This provides a consistent measurement of how much "room" the market moves in a given timeframe.
2. Smoothing the Data To prevent the indicator from reacting too erratically to single price spikes, the script takes these volatility measurements and applies a Moving Average calculation. By "smoothing" this data, the tool identifies the underlying trend of market movement rather than just the immediate noise. Users can customize how aggressively this smoothing occurs through the period settings.
3. Projecting the Boundaries Once the average volatility is determined, the indicator projects two distinct lines on the chart:
- The Upper Boundary: This is calculated by taking the highest price of a candle and adding a specific multiplier of the smoothed volatility.
- The Lower Boundary: This is calculated by taking the lowest price of a candle and subtracting that same multiplier of the smoothed volatility.
What this means for the trader
By visualizing these two boundaries, the indicator creates a "channel" around the current price action. Because the width of this channel expands or contracts based on actual market behavior (volatility), it serves as a guide to help identify areas where the price might be overextended. When the market is calm, the lines sit closer together; when the market becomes turbulent, the lines widen automatically to reflect the increased risk and movement.
#property indicator_chart_window
#property indicator_buffers 2
#property indicator_color1 DodgerBlue
#property indicator_color2 DodgerBlue
#property indicator_style1 STYLE_DOT
#property indicator_style2 STYLE_DOT

extern int __EPeriod=20;
extern double mul = 1.5;
extern int ma_mode = MODE_SMMA;

double __EBufferUp[];
double __EBufferDown[];

double TempBuffer[];

int init() {
   string short_name;

   IndicatorBuffers(3);

   SetIndexStyle(0,DRAW_LINE);
   SetIndexBuffer(0,__EBufferUp);
   SetIndexStyle(1,DRAW_LINE);
   SetIndexBuffer(1,__EBufferDown);


   SetIndexBuffer(2,TempBuffer);

   short_name="__E("+__EPeriod+")";
   IndicatorShortName(short_name);
   SetIndexLabel(0,short_name + "Up");
   SetIndexLabel(1,short_name + "Down");

   SetIndexDrawBegin(0,__EPeriod);

   return(0);
}

int start() {
   int i,counted_bars=IndicatorCounted();
   if(Bars<=__EPeriod) return(0);

   // inizializzazione nel caso di refresh basso
   if(counted_bars < 1)
      for(i=1;i<=__EPeriod;i++) {
         __EBufferUp[Bars-i]=0.0;
         __EBufferDown[Bars-i]=0.0;

      }

   i=Bars-counted_bars-1;
   while(i>=0) {
      double high=High[i];
      double low =Low[i];
      if(i==Bars-1) TempBuffer[i]=high-low;
      else {
         double prevclose=Close[i+1];
         TempBuffer[i]=MathMax(high,prevclose)-MathMin(low,prevclose);
      }
      i--;
   }

   if(counted_bars>0) counted_bars--;
   int limit=Bars-counted_bars;
   for(i=0; i<limit; i++) {
      __EBufferUp[i]=High[i] + (iMAOnArray(TempBuffer,Bars,__EPeriod,0,ma_mode,i) * mul);
      __EBufferDown[i]=Low[i] - (iMAOnArray(TempBuffer,Bars,__EPeriod,0,ma_mode,i) * mul);

   }
   return(0);
}
Comments