ER_EURUSD_USDCHF
Download script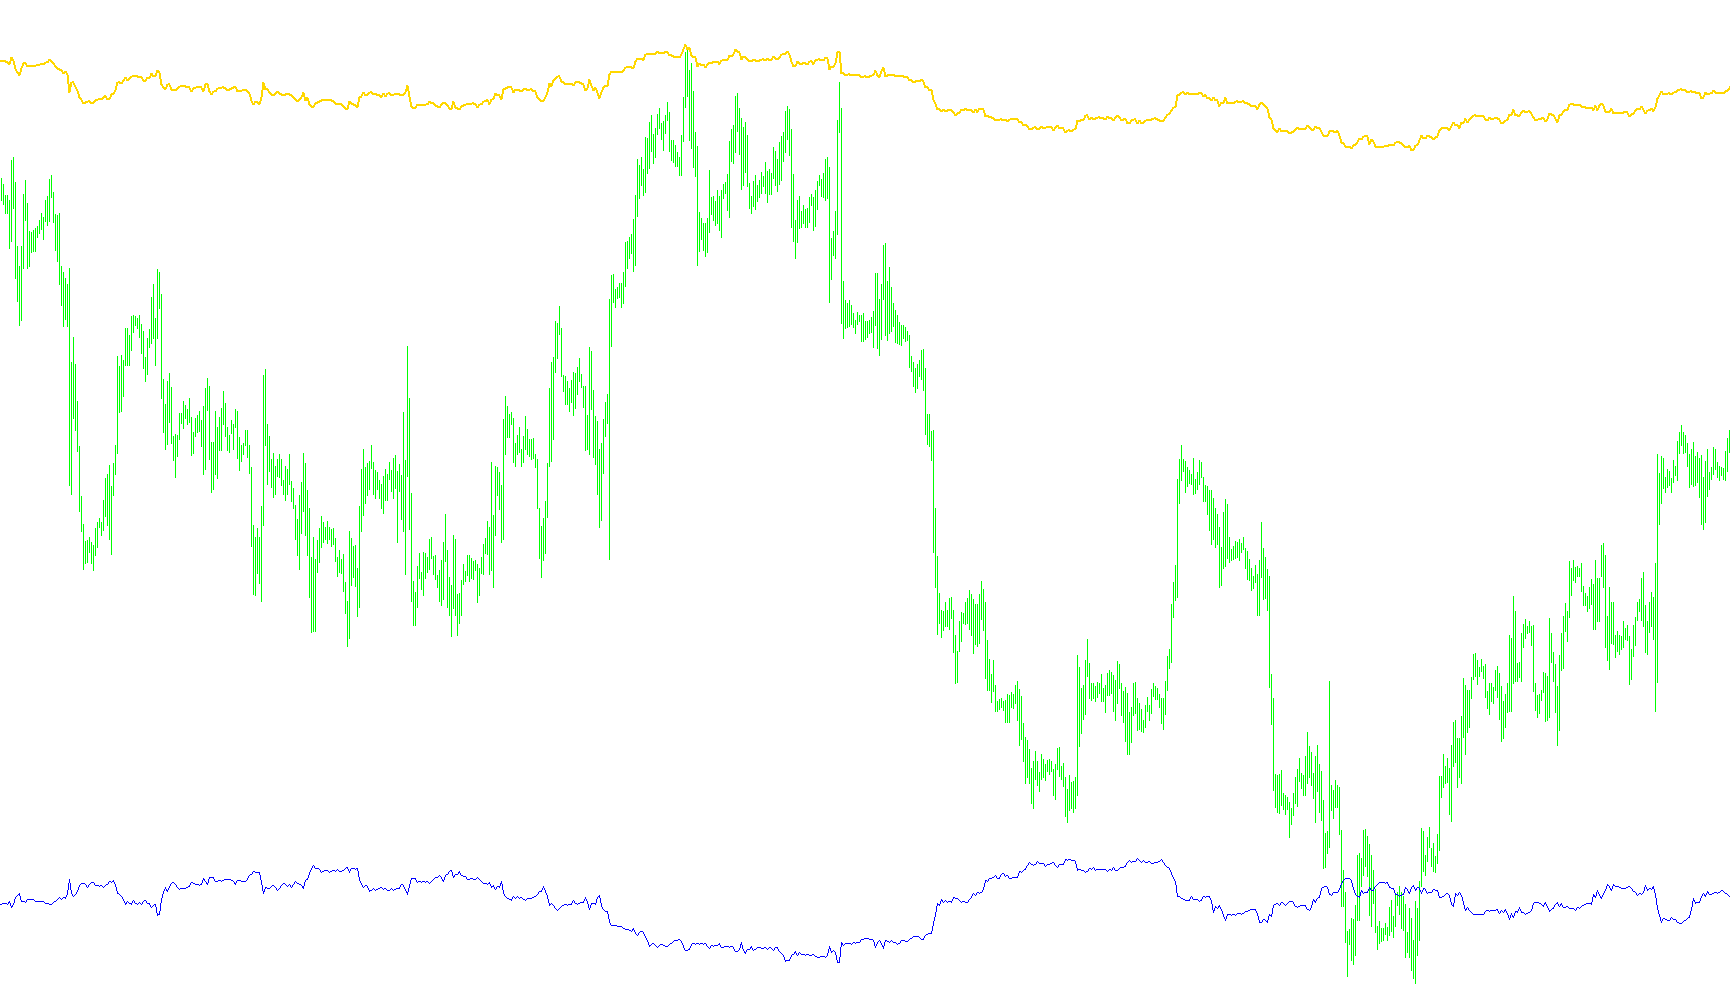
This tool is designed to allow traders to visualize and compare the price movements of two different financial assets simultaneously on a single chart. Instead of looking at two separate windows, this script brings external data into your current workspace so you can analyze correlations or relative values in real-time.
Core Functionality
The primary logic of the script revolves around "Multi-Asset Mapping." It tracks two specific currency pairs (or other assets) and plots their closing prices as continuous lines in a separate window below your main chart.
By comparing these two lines, you can easily see how different markets react to global economic events at the exact same moment.
How the Logic Works
To ensure accuracy, the script performs three specific tasks every time the market updates:
- Time Synchronization: The script does not simply pull the latest price from the other assets. It actively searches for the exact timestamp of your current chart and matches it with the corresponding data point on the two external symbols. This ensures that if you are looking at a 1-minute candle, you are seeing the prices from the other assets at that precise minute.
- Dynamic Scaling: The tool includes a specific multiplier (constant). This allows you to adjust the visual scale of one of the assets. Because different currencies have different values, this logic ensures that both lines remain visible and comparable on the same graph, rather than one line appearing flat while the other moves significantly.
- Visual Differentiation: The script assigns distinct colors (Lime and Blue) to the two different data feeds. This creates a clear visual separation, allowing you to identify which line belongs to which asset instantly.
Summary for the User
Think of this tool as a "Dual-Monitor" view contained within a single window. It automates the tedious task of switching between tabs or windows to check other currencies. By syncing the times perfectly and allowing for visual scaling, it provides a streamlined way to observe how two different markets are moving in tandem.
//+------------------------------------------------------------------+
//|                                           MultiMovingAverage.mq4 |
//+------------------------------------------------------------------+
#property copyright "Ron T"
#property link      "http://www.lightpatch.com"

#property indicator_separate_window
#property indicator_buffers 2
#property indicator_color1 Lime
#property indicator_color2 Blue
extern string sym1="EURUSD";
extern string sym2="USDCHF";
extern double const1=1.09;//1.08;
//---- buffers
double VolBuffer1[];
double VolBuffer2[];
//+------------------------------------------------------------------+
//| Custom indicator initialization function                         |
//|------------------------------------------------------------------|

int init()
  {
  if(StringFind(Symbol(),"m",0)>0)
   {
      sym1=sym1+"m";
      sym2=sym2+"m";
   }

   IndicatorBuffers(2);
   SetIndexStyle(0,DRAW_LINE,0,2);
   SetIndexBuffer(0, VolBuffer1);
   SetIndexStyle(1,DRAW_LINE,0,1);
   SetIndexBuffer(1, VolBuffer2);

   return(0);
  }


//+------------------------------------------------------------------+
//| Custor indicator deinitialization function                       |
//+------------------------------------------------------------------+
int deinit()
  {
/*
   int i;

   for( i=0; i<Bars; i++ ) VolBuffer1[i]=0;

   return(0);
*/
  }

/*
     int pos1 = iBarShift("GOLD", 0, iTime(NULL,0,x), true);
		if (iTime("GOLD", 0, pos1) == iTime(NULL,0,x))  // have to be sure the times match.
		{
		 	open8[x]=iVolume("GOLD",0,pos1)/const1();//1*0.25*l1;
		}
		else
		{
			open8[x]=0;//1*0.25*l1;
		}
*/

//+------------------------------------------------------------------+
//| Custom indicator iteration function                              |
//+------------------------------------------------------------------+
int start()
  {

   double curTYP=0;
   double oldTYP=0;
   double change=0;

   double x1,x2;

   int pos=Bars;///4;

   // Print ("Start SHOW5TICKS with bars=",pos);

   while(pos>=0)
     {
      //VolBuffer1[pos]=iClose("DOWJONES",0,pos);//Close[pos];
      int pos1 = iBarShift(sym1, 0, iTime(NULL,0,pos), true);
		if (iTime(sym1, 0, pos1) == iTime(NULL,0,pos))  // have to be sure the times match.
		{ x1=(iClose(sym1,0,pos1));

		  VolBuffer1[pos]=x1;//1*0.25*l1;
		}
		else
		{
			//VolBuffer1[pos]=x1;//1*0.25*l1;
		}

      //VolBuffer1[pos]=iClose("GOLD",0,pos);//Close[pos];
      int pos2 = iBarShift(sym2, 0, iTime(NULL,0,pos), true);
		if (iTime(sym2, 0, pos2) == iTime(NULL,0,pos))  // have to be sure the times match.
		{ x2=iClose(sym2,0,pos2);
		 	 VolBuffer2[pos]=x2*const1;//1*0.25*l1;
		}
		else
		{
			//VolBuffer2[pos]=x2;//1*0.25*l1;
		}

 	   pos--;
     }
 /*
   int i;

   for( i=0; i<Bars; i++ ) VolBuffer1[i]=1;
*/

   return(0);
  }
//+------------------------------------------------------------------+
Comments