#_i_FFT_separate_Volume2_H
Download script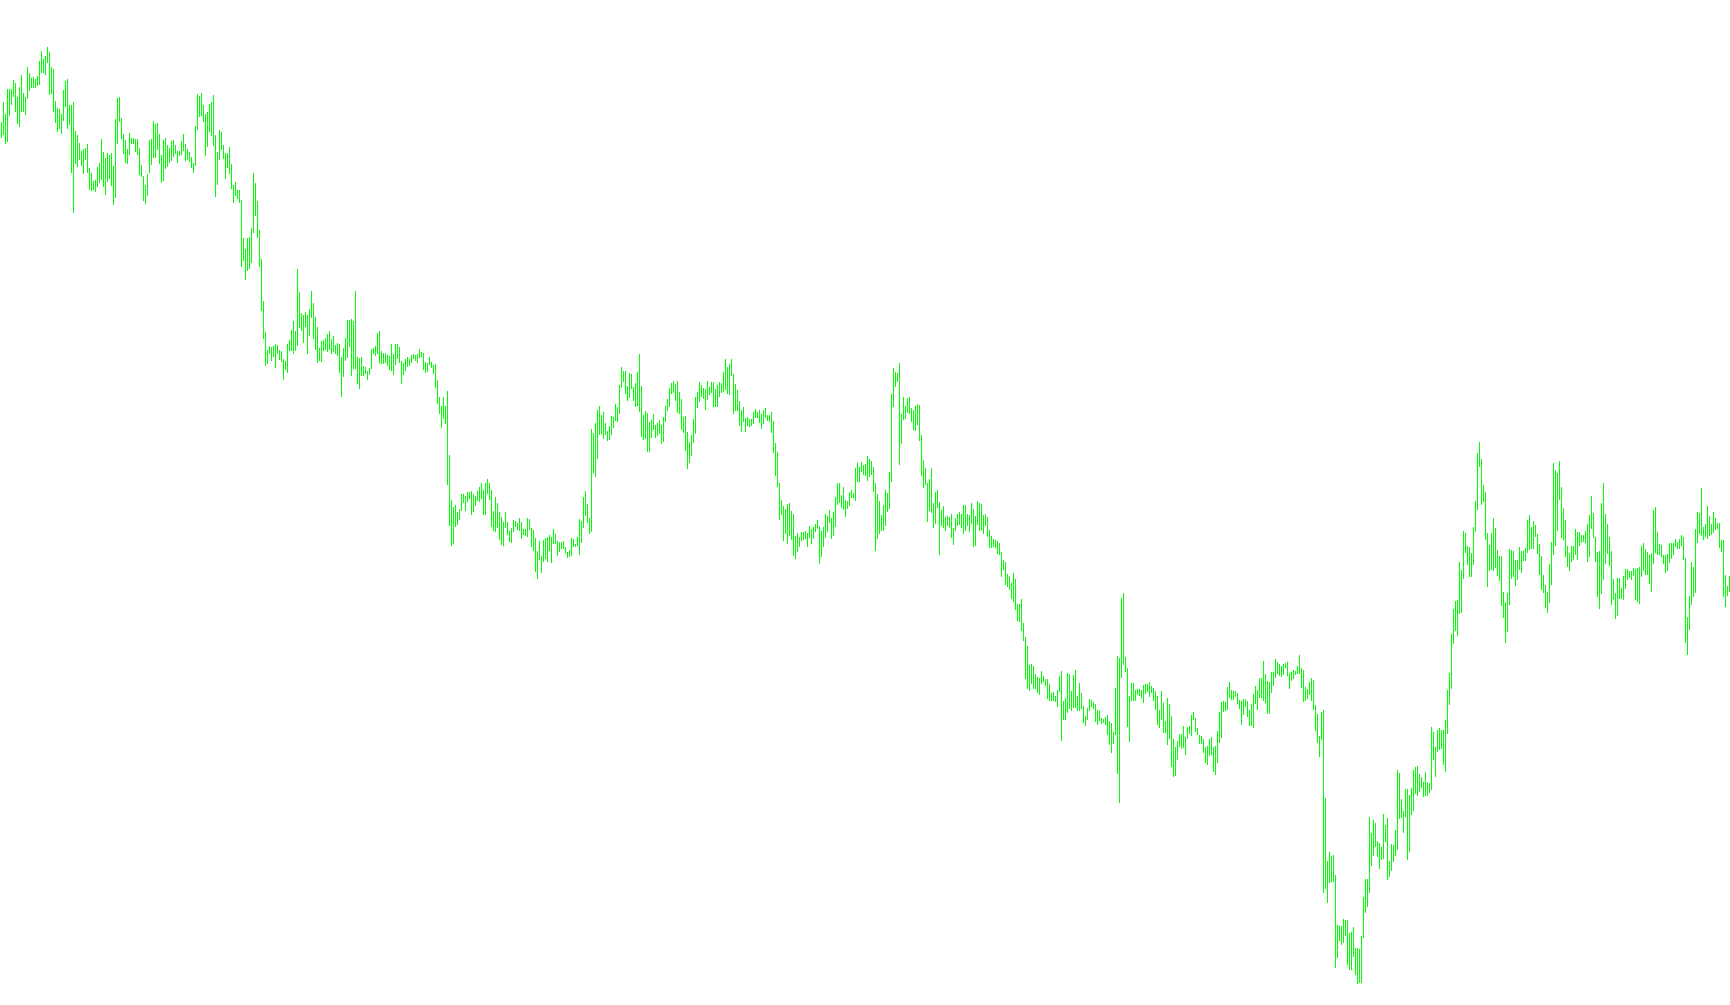
This tool is designed to analyze market behavior by examining the underlying "rhythm" or frequency of trading volume. Instead of looking at price movements directly, it focuses on how active the market is, breaking down complex data into simpler, digestible components.
How the Logic Works
The script operates using a mathematical process called a Fast Fourier Transform. You can think of this like a prism for sound: just as a prism breaks white light into individual colors, this tool breaks down a chaotic stream of trading volume into its individual frequencies (cycles).
Here is the step-by-step breakdown of how it processes your data:
1. Data Collection The tool looks at two different sets of historical trading volume. It captures these "pulses" from the market to see how many transactions are occurring over a specific window of time.
2. Frequency Analysis By applying the Fourier Transform, the script identifies hidden patterns within those volumes. It detects whether the market is moving in short, rapid bursts or longer, slower cycles. This allows the tool to separate "noise" from actual structural trends.
3. Signal Filtering Not all frequencies are useful for trading. The tool includes specific filters (minimum and maximum boundaries) that allow you to ignore the "static"—the very high-frequency jitter or the very low-frequency drifts that don't provide actionable information. It isolates the specific range of activity that most interests the user.
4. Reconstruction After filtering out the unwanted noise, the tool performs an "inverse" calculation. It puts the remaining clean data back together to create a visual representation.
The Final Result
The output provides two distinct lines on your chart:
- Primary Data: The processed frequency of the current volume.
- Shifted Data: A secondary comparison point (offset by a set amount) that allows you to visually compare two different points in time or two different market states side-by-side.
By using this logic, the tool helps traders see the "heartbeat" of the market, making it easier to identify repeating cycles and structural shifts in trading activity that are often invisible to the naked eye on a standard price chart.
//+------------------------------------------------------------------+
//|                                            #_i_SpecktrAnalis.mq4 |
//|                                          Copyright © 2006, klot. |
//|                                                     klot@mail.ru |
//+------------------------------------------------------------------+
#property copyright "Copyright © 2006, klot."
#property link      "klot@mail.ru"


#import "#_lib_FFT.ex4"
void realfastfouriertransform(double& a[], int tnn, bool inversefft);
#import

#property indicator_separate_window
#property indicator_buffers 2
#property indicator_color1 Red
#property indicator_color2 Blue
#property indicator_level1 0.0
//#property indicator_level1 0.0
//#property indicator_level1 0.0
//---- buffers
double Buffer1[];
double Buffer2[];
//---
extern int n=7; // Äëèíà ðÿäà
extern int Fmin=90;//2; // Ãðíèöà Ôèëüòðà ïî Í×.
extern int Fmax=128;//128; // Ãðàíèöà Ôèëüòðà ïî Â×.
extern int shift=0;//127;
//extern string sym="GBPUSD";
//extern string sym="EURUSD";

double aa[];
double bb[];
int N;

//+------------------------------------------------------------------+
//| Custom indicator initialization function                         |
//+------------------------------------------------------------------+
int init()
  {
//---- indicators
SetIndexStyle(0,DRAW_LINE);
SetIndexBuffer(0,Buffer1);
SetIndexStyle(1,DRAW_LINE);
SetIndexBuffer(1,Buffer2);
//---
   N=MathPow(2,n);
   ArrayResize(aa,N);
   ArrayResize(bb,N);

if( Fmax>=N ) Fmax=N;
if( Fmin<=2 ) Fmin=2;

//----
   return(0);
  }
//+------------------------------------------------------------------+
//| Custom indicator deinitialization function                       |
//+------------------------------------------------------------------+
int deinit()
  {
//----

//----
   return(0);
  }
//+------------------------------------------------------------------+
//| Custom indicator iteration function                              |
//+------------------------------------------------------------------+
int start()
  {

   if( Bars<N+shift) return(0);

   //---
   for(int i=N-1; i>=0; i--)
   {
     aa[i]=iVolume(Symbol(),0,i);
     bb[i]=iVolume(Symbol(),0,i+shift);
   }
   //---
   realfastfouriertransform(aa, N, false);
   realfastfouriertransform(bb, N, false);
   //---
   N=ArraySize(aa);
   //Comment("n= ",N);
   //---
   for( i=0; i<=N-1; i++)
   {
      if( i<Fmin || i>Fmax) { aa[i]=0.0;bb[i]=0.0; }
   }
   //---
   //realfastfouriertransform(double& a[], int tnn, bool inversefft);
   realfastfouriertransform(aa, N, true);
   realfastfouriertransform(bb, N, true);
   //tworealffts(double a1[], double a2[],  double& a[],  double& b[], int tn);
   //---
   SetIndexDrawBegin(0,Bars-N);
   //SetIndexDrawBegin(1,Bars-N-shift);
   SetIndexDrawBegin(1,Bars-N);
   //---
   for( i=0; i<=N-1; i++)
   {
      Buffer1[i]=aa[i];
      //Buffer2[i+shift]=bb[i];
      Buffer2[i]=bb[i];
   }
   //----
   return(0);
  }
//-------------------------------------------------------------------+
Comments