+EURUSD
Download script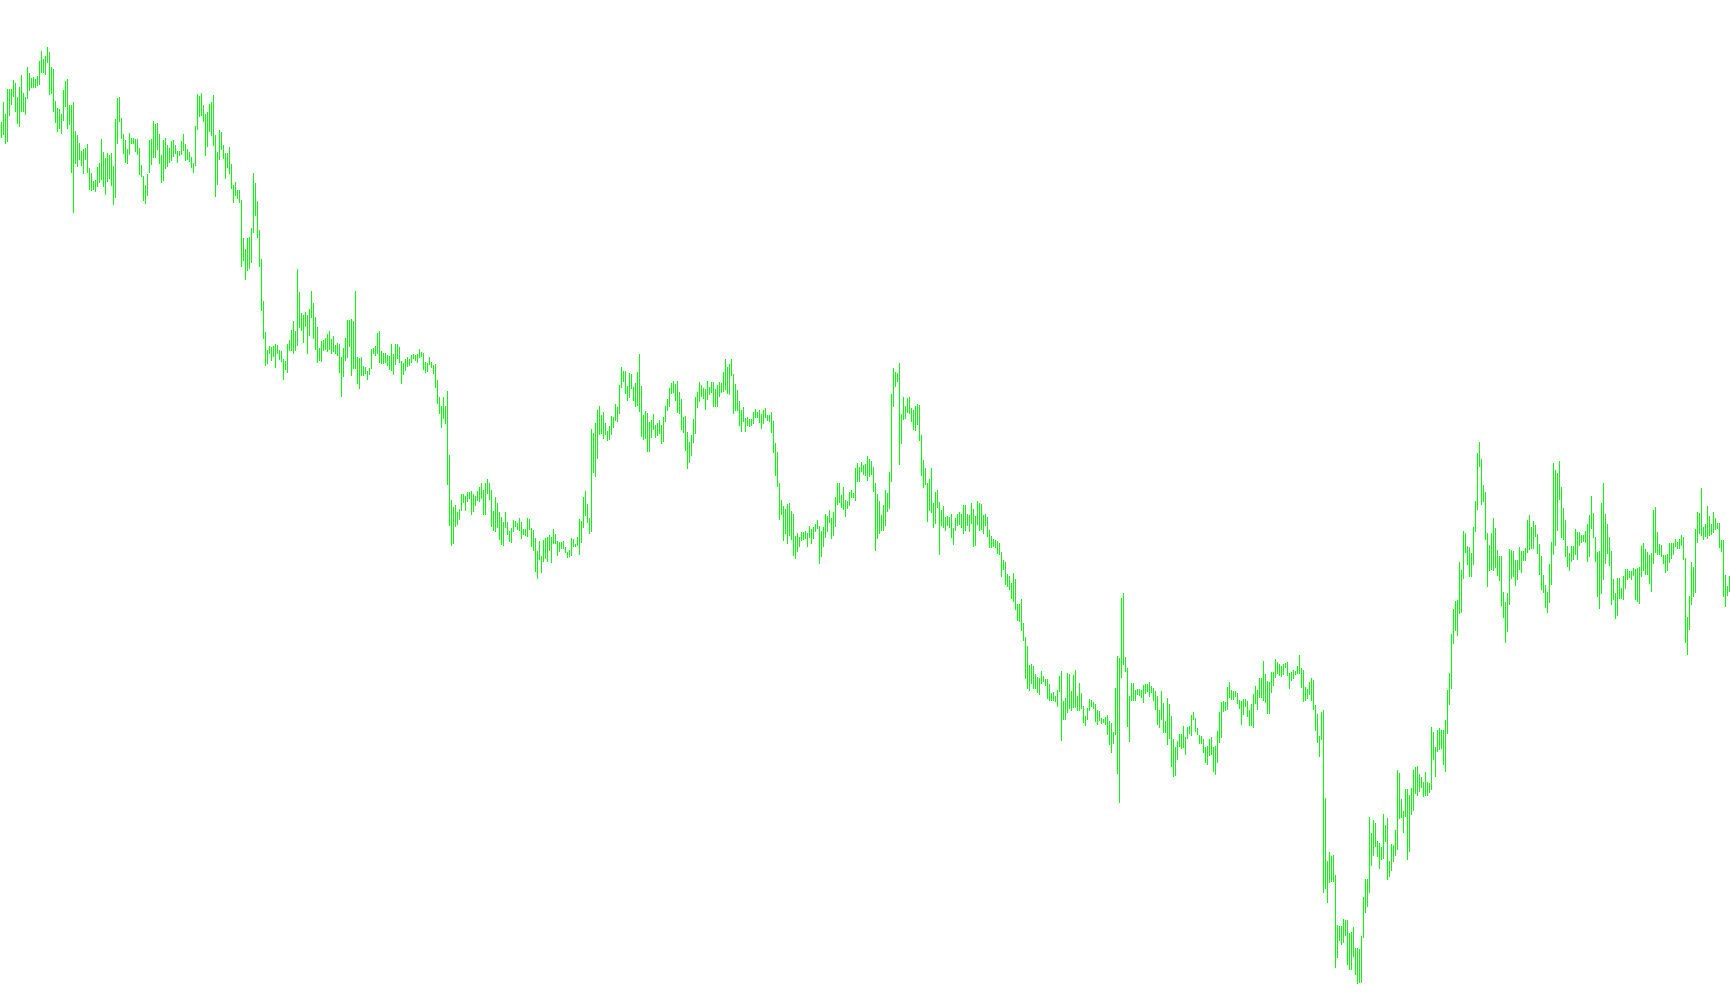
This tool is designed to help traders visualize a specific price relationship between two different currency pairs on a single chart. Instead of requiring you to monitor multiple windows simultaneously, it mathematically projects the movement of one currency pair onto the chart of another.
How the Logic Works
The core functionality of this script relies on proportional scaling. It takes the real-time price data from a secondary currency pair (in this case, EURUSD) and converts it into a format that matches the scale of the primary chart you are currently viewing.
To achieve this, the script utilizes two specific numerical constants:
- The Target Rate: A fixed reference point for the currency pair being tracked.
- The Comparison Rate: A secondary reference point used to establish the mathematical ratio between the two different assets.
The Process
- Data Retrieval: The script constantly pulls live price data—including opening prices, highs, lows, and closing prices—from the designated external currency pair.
- Mathematical Conversion: It applies a conversion formula to this data. By multiplying the external price by the target rate and then dividing it by the comparison rate, it "re-scales" the numbers.
- Visual Projection: Once the data is converted to match the scale of your current chart, the script draws it as a histogram.
What this means for the user
Essentially, the script creates a "shadow" or a "mirror" of one currency pair's behavior on another. This allows you to see how closely two assets are moving in relation to each other in real-time. If the two currencies move in perfect synchronization based on the ratios provided, the visual representation will stay consistent; if they diverge, the visual shift will alert you to that discrepancy immediately.
//+------------------------------------------------------------------+
//|                                                      xEURUSD.mq4 |
//|                                    Copyright © 2006, AlexSilver. |
//|                                                  http://viac.ru/ |
//+------------------------------------------------------------------+
#property copyright "Copyright © 2006, AlexSilver"
#property link      "http://viac.ru/"

#property indicator_chart_window //indicator_separate_window
#property indicator_buffers 4
#property indicator_color1 Red
#property indicator_color2 Blue
#property indicator_color3 Red
#property indicator_color4 Blue

extern string Curency = "EURUSD";
extern double K = 1.7531; // the rate of pair to which should be adhered EURUSD
extern double xK = 1.2120; // the rate of EURUSD on same time

double EurUsd[];
double EurUsd_h[];
double EurUsd_l[];
double EurUsd_o[];
double xOpen[];
double xHigh[];
double xLow[];
double xClose[];


int init()
{
   IndicatorShortName(Curency);
   SetIndexStyle(0, DRAW_HISTOGRAM, 0, 1, Red);
   SetIndexBuffer(0,xLow);
   SetIndexStyle(1, DRAW_HISTOGRAM, 0, 1, Blue);
   SetIndexBuffer(1,xHigh);
   SetIndexStyle(2, DRAW_HISTOGRAM, 0, 3, Red);
   SetIndexBuffer(2,xOpen);
   SetIndexStyle(3, DRAW_HISTOGRAM, 0, 3, Blue);
   SetIndexBuffer(3,xClose);

   return(0);
}

void start()
{
   ArrayCopySeries(EurUsd_o,MODE_OPEN,"EURUSD");
   ArrayCopySeries(EurUsd_h,MODE_HIGH,"EURUSD");
   ArrayCopySeries(EurUsd_l,MODE_LOW,"EURUSD");
   ArrayCopySeries(EurUsd,MODE_CLOSE,"EURUSD");

   int counted_bars=IndicatorCounted();

   if(counted_bars<0) return(-1);
   if(counted_bars>0) counted_bars--;
   int limit=Bars-counted_bars;
   for(int i=0; i<limit; i++)
   {
       xClose[i] = EurUsd[i]*K/xK;
       xOpen[i] = EurUsd_o[i]*K/xK;
       xHigh[i] = EurUsd_h[i]*K/xK;
       xLow[i] = EurUsd_l[i]*K/xK;
   }
}
Comments