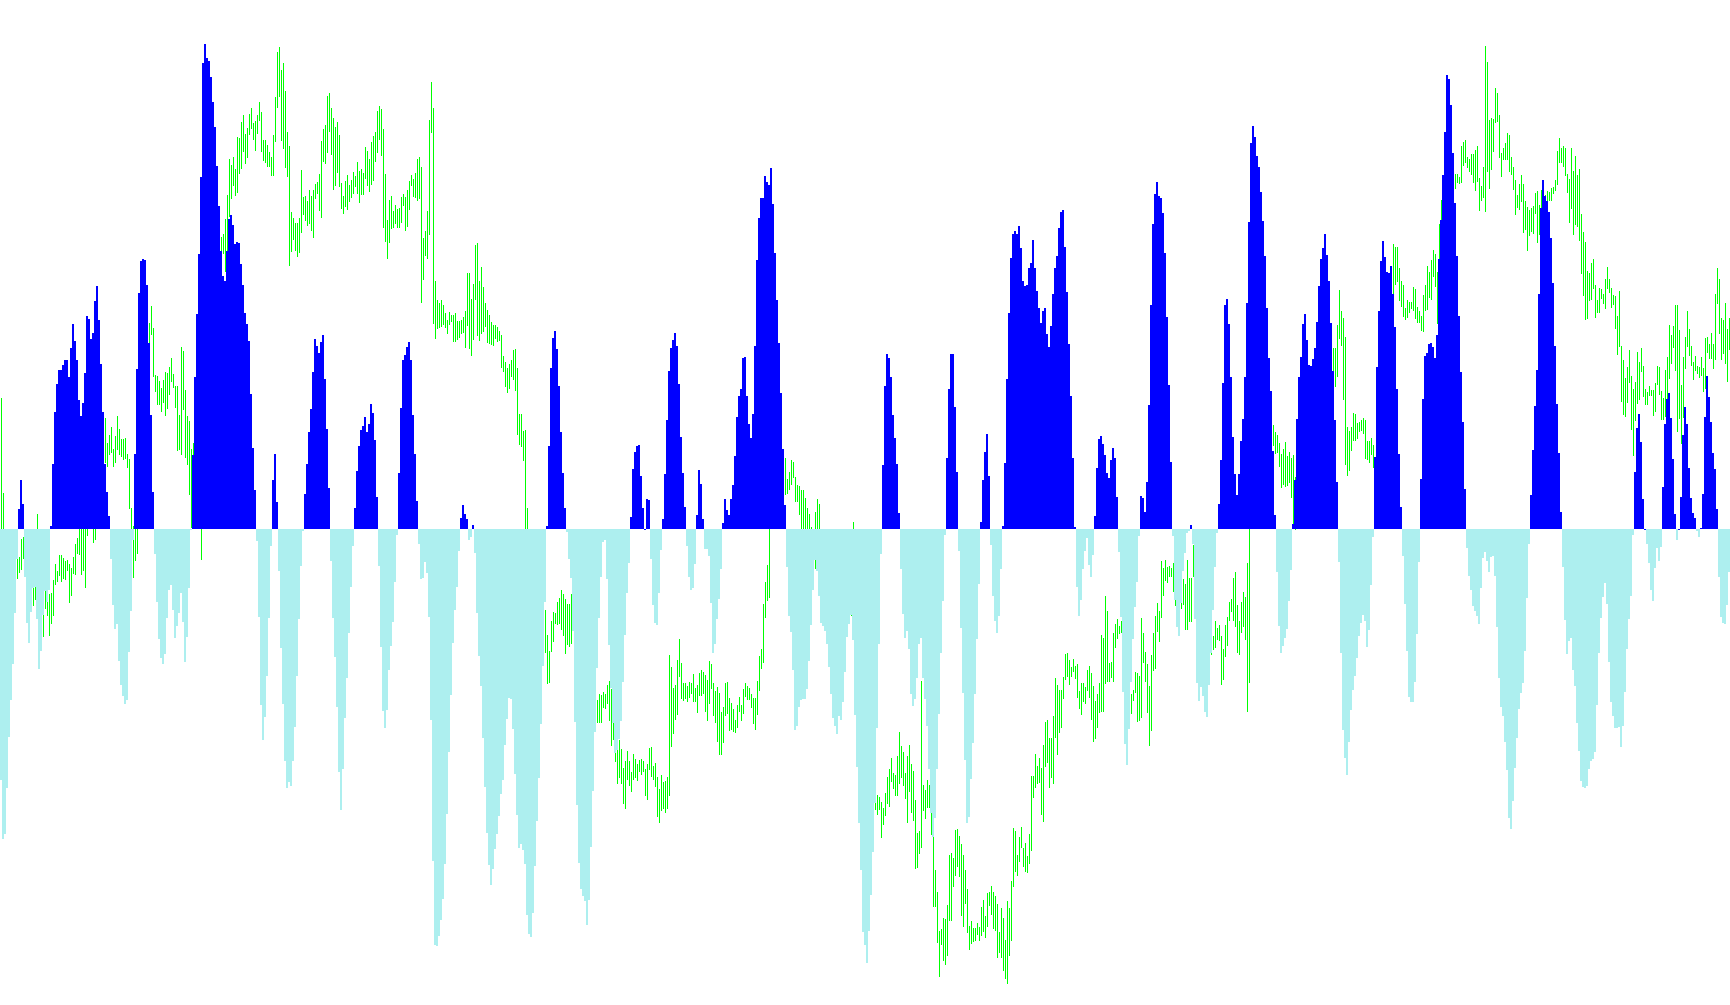
This technical tool, titled "Solar Wind," is designed to provide traders with a visual representation of market momentum and trend direction. It functions by analyzing price action over a specific period to distinguish between bullish (upward) and bearish (downward) sentiments.
Core Logic and Data Processing
The script begins by scanning the market history to identify the highest highs and lowest lows within a user-defined timeframe. By comparing the current mid-price of a candle against these extremes, the tool calculates a normalized value that represents where the price sits within its recent range.
To ensure the data is smooth and readable, the script applies a weighted moving average logic. This means it doesn't just look at one single moment in time; instead, it blends the current price position with previous results. This prevents "choppiness" and helps filter out minor market noise, focusing on the broader trajectory of the price.
Signal Generation
Once the core values are calculated, the script performs two distinct actions:
- Logarithmic Scaling: It transforms the raw data into a specific mathematical curve. This helps in visualizing the intensity of the movement more clearly than a standard linear line.
- Trend Segmentation: The tool looks for "crossovers." It constantly monitors whether the calculated value is moving above or below the zero baseline.
Visual Representation
The indicator translates these complex calculations into a clear, dual-histogram display:
- Bullish Sentiment: When the momentum is positive (above the zero line), the script highlights this with a specific color (Lime). This tells the user that the prevailing trend is upward.
- Bearish Sentiment: When the momentum turns negative (below the zero line), the script switches the highlight to another color (Red), signaling downward pressure.
By providing these distinct visual blocks, the tool allows traders to quickly identify which "side" of the market the current price action favors without needing to interpret raw numbers manually.
/*-----------------------------+
|			       |
| Shared by www.Aptrafx.com    |
|			       |
+------------------------------*/

#property  copyright "Copyright © 2005, Yura Prokofiev"
#property  link      "Yura.prokofiev@gmail.com"

#property  indicator_separate_window
#property  indicator_buffers 3
#property  indicator_color1  Black
#property  indicator_color2  Lime
#property  indicator_color3  Red

extern int period=10;


double         ExtBuffer0[];
double         ExtBuffer1[];
double         ExtBuffer2[];


int init()
  {


   SetIndexStyle(0,DRAW_NONE);
   SetIndexStyle(1,DRAW_HISTOGRAM,STYLE_SOLID,2);
   SetIndexStyle(2,DRAW_HISTOGRAM,STYLE_SOLID,2);
   IndicatorDigits(Digits+1);

   SetIndexBuffer(0,ExtBuffer0);
   SetIndexBuffer(1,ExtBuffer1);
   SetIndexBuffer(2,ExtBuffer2);

   IndicatorShortName("SOLAR WIND");
   SetIndexLabel(1,NULL);
   SetIndexLabel(2,NULL);

   return(0);
  }


int start()
  {
   //int     period=10;
   int    limit;
   int    counted_bars=IndicatorCounted();
   double prev,current,old;
   double Value=0,Value1=0,Value2=0,Fish=0,Fish1=0,Fish2=0;
   double price;
   double MinL=0;
   double MaxH=0;


   if(counted_bars>0) counted_bars--;
   limit=Bars-counted_bars;


   for(int i=0; i<limit; i++)
    {  MaxH = High[Highest(NULL,0,MODE_HIGH,period,i)];
       MinL = Low[Lowest(NULL,0,MODE_LOW,period,i)];
      price = (High[i]+Low[i])/2;
      Value = 0.33*2*((price-MinL)/(MaxH-MinL)-0.5) + 0.67*Value1;
      Value=MathMin(MathMax(Value,-0.999),0.999);
      ExtBuffer0[i]=0.5*MathLog((1+Value)/(1-Value))+0.5*Fish1;
      Value1=Value;
      Fish1=ExtBuffer0[i];

    }


   bool up=true;
   for(i=limit-2; i>=0; i--)
     {
      current=ExtBuffer0[i];
      prev=ExtBuffer0[i+1];

      if (((current<0)&&(prev>0))||(current<0))   up= false;
      if (((current>0)&&(prev<0))||(current>0))   up= true;

      if(!up)
        {
         ExtBuffer2[i]=current;
         ExtBuffer1[i]=0.0;
        }

       else
         {
          ExtBuffer1[i]=current;
          ExtBuffer2[i]=0.0;
         }
     }

   return(0);
  }
Comments