super signals v2_001
Download script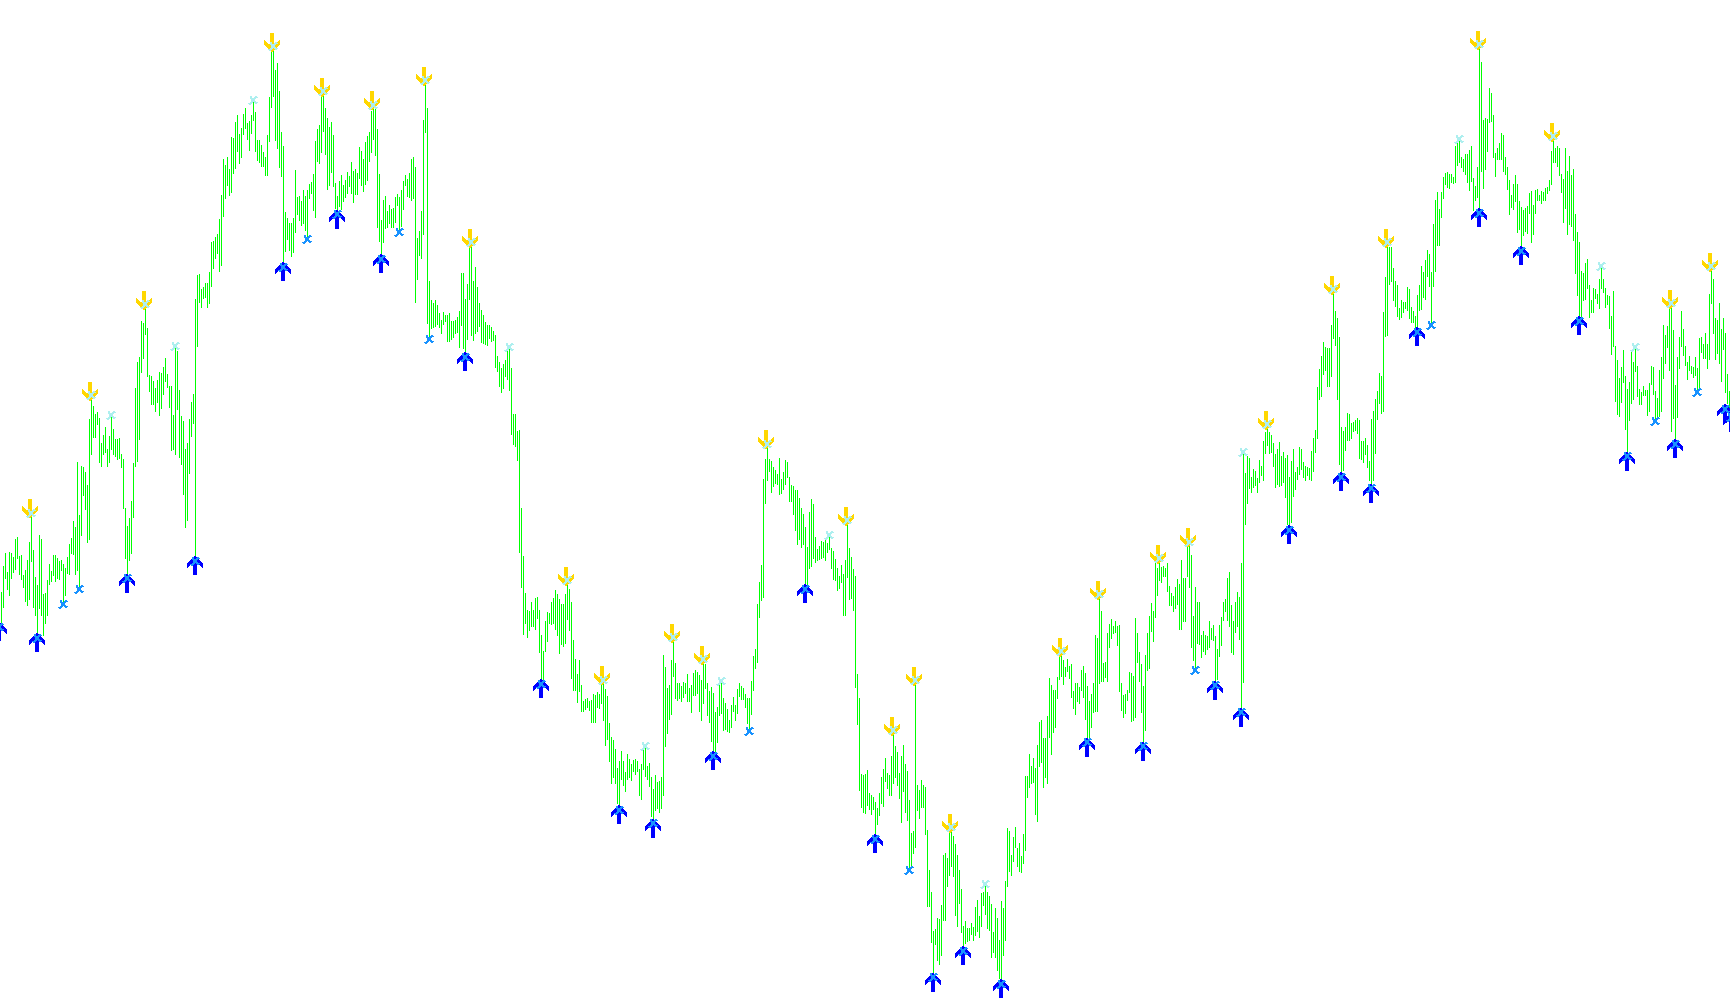
This tool is designed as a visual navigation aid for traders, providing real-time automated alerts and on-chart markers to identify significant price movements. By analyzing historical price data, the script scans for specific peaks and valleys to help users recognize potential shifts in market momentum.
How the Logic Works
The core functionality of this script relies on identifying "extremes"—the highest and lowest points reached within specific timeframes. It operates using two distinct scanning windows:
- Primary Signals (Short-Term Momentum): The script looks at a smaller, more immediate window of price action. When it identifies that the current price is hitting a new relative high or low within this period, it triggers a signal. These act as early indicators of momentum shifts, providing alerts for potential upward movements ("Going Up") or downward movements ("Going Down").
- Secondary Signals (Trend Reversals): Simultaneously, the script monitors a larger, broader window of price action. By comparing the current price against these longer-term extremes, it identifies more significant structural shifts. These are used to signal potential exit points—specifically, "Close Buy" or "Close Sell" alerts—helping traders identify when a trend may be losing its strength and reaching a point of exhaustion.
Visual and Audio Notifications
To ensure traders can react quickly, the script provides three layers of feedback:
- On-Chart Markers: The tool automatically places visual symbols (arrows) directly on your trading chart at the exact moments these price extremes are detected. This allows for easy backtesting and visual confirmation of previous market turns.
- Real-Time Alerts: The script is programmed to trigger pop-up notifications on your screen the moment a signal is confirmed on the most recent candle.
- Audio Cues: With the settings enabled, the tool provides audible alerts to notify you of new signals and trend reversals instantly, ensuring you don't have to watch the screen constantly to stay updated.
Summary of Operation
In essence, the script acts as an automated "scout." It constantly watches for price peaks and troughs across two different time horizons. It then highlights these events on your chart and sends a notification to your device, helping you distinguish between minor price fluctuations and more significant trend shifts.
//+------------------------------------------------------------------+
//|                                             super-signals_v2.mq4 |
//|                Copyright © 2006, Nick Bilak, beluck[AT]gmail.com |
//+------------------------------------------------------------------+
#property copyright "Copyright © 2006, Nick Bilak"
#property copyright "alterations by Mark Tomlinson"
#property link      "http://www.forex-tsd.com/"

#property indicator_chart_window
#property indicator_buffers 4
#property indicator_color1 Orange
#property indicator_color2 Yellow
#property indicator_color3 Magenta
#property indicator_color4 LightYellow
//input properties

extern int dist2=21;
extern int dist1=14;
extern bool sounds=true;
extern bool exitsounds=true;
double b1[];
double b2[];
double b3[];
double b4[];
double alertTag;


int init()  {
   SetIndexStyle(0,DRAW_ARROW,STYLE_SOLID,2);
   SetIndexStyle(1,DRAW_ARROW,STYLE_SOLID,2);
   SetIndexStyle(2,DRAW_ARROW,STYLE_SOLID,2);
   SetIndexStyle(3,DRAW_ARROW,STYLE_SOLID,2);
   SetIndexArrow(1,333);
   SetIndexArrow(0,334);
   SetIndexArrow(1,233);
   SetIndexArrow(0,234);
   SetIndexBuffer(0,b1);
   SetIndexBuffer(1,b2);
   SetIndexBuffer(2,b3);
   SetIndexBuffer(3,b4);
   return(0);
}
int start() {
   int counted_bars=IndicatorCounted();
   int k,i,j,limit,hhb,llb,hhb1,llb1;

   if (counted_bars<0) return(-1);
   if (counted_bars>0) counted_bars--;
   limit=Bars-1;
   if(counted_bars>=1) limit=Bars-counted_bars-1;
   if (limit<0) limit=0;

   for (i=limit;i>=0;i--)   {
      hhb1 = Highest(NULL,0,MODE_HIGH,dist1,i-dist1/2);
      llb1 = Lowest(NULL,0,MODE_LOW,dist1,i-dist1/2);
      hhb= Highest(NULL,0,MODE_HIGH,dist2,i-dist2/2);
      llb= Lowest(NULL,0,MODE_LOW,dist2,i-dist2/2);

      if (i==hhb){
         b1[i]=High[hhb]+10*Point;
         if(sounds==true && i == 1 && alertTag!=Time[0]) Alert("Super Signals Going Down on ",Symbol()," Period ",Period()," i= ",i);
         alertTag = Time[0];
         }
      if (i==llb){
         b2[i]=Low[llb]-10*Point;
        if(sounds==true && i == 1 && alertTag!=Time[0]) Alert("Super Signals Going Up on ",Symbol()," Period ",Period()," i= ",i);
        alertTag = Time[0];
         }
      if (i==hhb1){
         b3[i]=High[hhb1]+4*Point;
        if(exitsounds==true && i == 1 && alertTag!=Time[0]) Alert("Super Signals Close Buy on ",Symbol()," Period ",Period()," i= ",i);
       alertTag = Time[0];
         }
      if (i==llb1){
         b4[i]=Low[llb1]-4*Point;
      if(exitsounds==true && i == 1 && alertTag!=Time[0]) Alert("Super Signals Close sell on ",Symbol()," Period ",Period()," i= ",i);
      alertTag = Time[0];
         }
      }
  return(0);
}
Comments