HMA_Russian_Color_sep_v1
Download script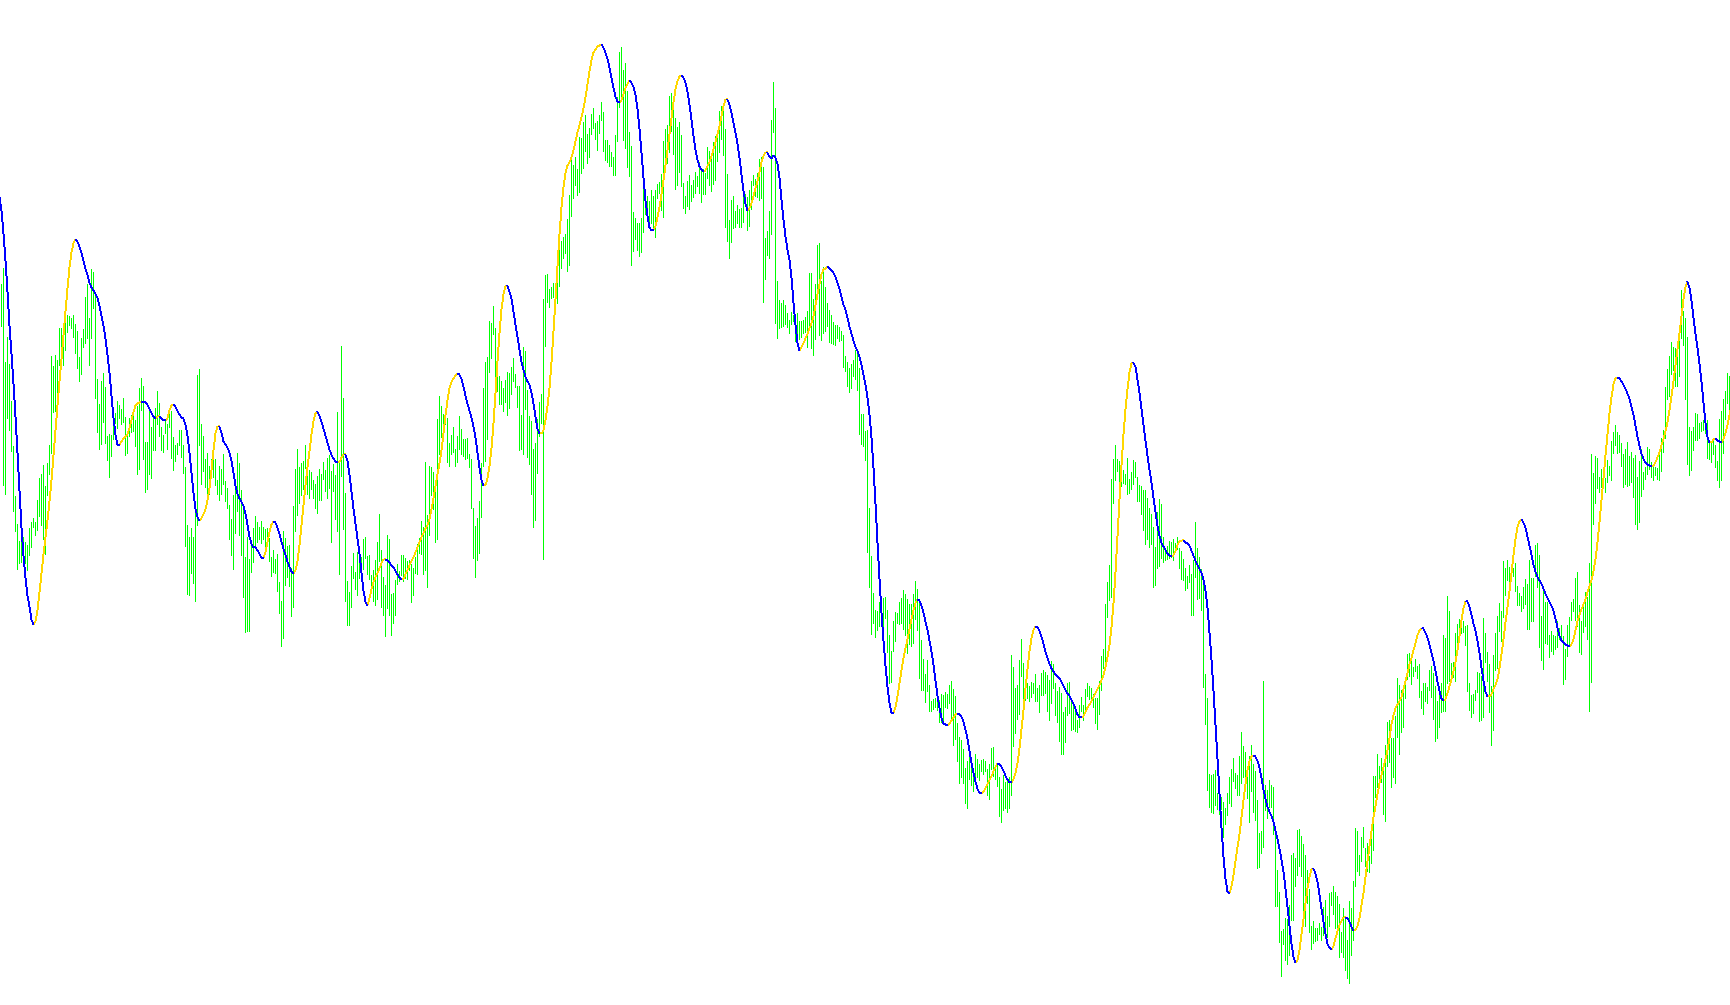
This tool is designed to provide traders with a smoothed, responsive visual representation of market trends. Unlike standard moving averages that can often lag behind current price action—causing a trader to enter or exit a position too late—this script utilizes the logic of the Hull Moving Average (HMA). The primary goal of this logic is to reduce "noise" in the market while maintaining a very high level of sensitivity to rapid price changes.
How the Logic Works
The script processes market data through three distinct stages to arrive at the final visual output:
1. Signal Smoothing and Weighting Instead of simply averaging prices over a set period, the script performs a mathematical calculation that weights recent price movements more heavily. It takes two different weighted averages—one based on half of your chosen timeframe and one based on the full timeframe—and combines them. This specific formula allows the indicator to "track" the price more closely than a traditional moving average would.
2. Trend Extraction (The "Hull" Calculation) Once the initial smoothing is applied, the script performs a second layer of calculation. It takes the result of the first step and applies a final weighted moving average over it. This double-smoothing process effectively "flattens" out minor fluctuations (market noise) while ensuring that when a significant trend shift occurs, the indicator responds almost instantly.
3. Dynamic Trend Identification The final stage of the logic involves categorizing the movement into specific visual trends:
- Upward Momentum: When the smoothed line moves higher than its previous point, the script identifies an "Uptrend." It highlights this specifically so that the user can clearly see periods of bullish sentiment.
- Downward Momentum: Conversely, when the line moves lower, it identifies a "Downtrend."
- Switch Detection: The logic is designed to recognize the exact moment the trend flips from positive to negative (or vice versa). It handles these transitions by isolating the data points so that only the active trend is emphasized on your chart.
Summary for the User
By using this script, you are looking at a refined version of price action. Rather than seeing every tiny "wiggle" in the market, this logic filters out the distractions and shows you the underlying direction. The resulting lines provide a clearer view of whether the current momentum is moving up or down, helping to make more informed decisions on entry and exit points based on the prevailing trend.
/*-----------------------------+
|			       |
| Shared by www.Aptrafx.com    |
|			       |
+------------------------------*/

//+------------------------------------------------------------------+
//| HMA.mq4
//| Copyright © 2006 WizardSerg <wizardserg@mail.ru>, ?? ??????? ForexMagazine #104
//| wizardserg@mail.ru
//|                         Revised by IgorAD,igorad2003@yahoo.co.uk |
//|                                        http://www.forex-tsd.com/ |
//+------------------------------------------------------------------+
#property copyright "MT4 release WizardSerg <wizardserg@mail.ru>, ?? ??????? ForexMagazine #104"
#property link      "wizardserg@mail.ru"

#property indicator_separate_window
#property indicator_buffers 2
#property indicator_color1 Aqua
#property indicator_color2 Tomato
//---- input parameters
extern int       period=21;
extern int       method=0;                         // MODE_SMA
extern int       price=0;                          // PRICE_CLOSE
//---- buffers
double Uptrend[];
double Dntrend[];
double ExtMapBuffer[];


//+------------------------------------------------------------------+
//| Custom indicator initialization function                         |
//+------------------------------------------------------------------+
int init()
{
    IndicatorBuffers(3);
    SetIndexBuffer(0, Uptrend);
    //ArraySetAsSeries(Uptrend, true);
    SetIndexBuffer(1, Dntrend);
    //ArraySetAsSeries(Dntrend, true);
    SetIndexBuffer(2, ExtMapBuffer);
    ArraySetAsSeries(ExtMapBuffer, true);

    SetIndexStyle(0,DRAW_LINE,STYLE_SOLID,2);
    SetIndexStyle(1,DRAW_LINE,STYLE_SOLID,2);

    IndicatorShortName("Hull Moving Average("+period+")");
    return(0);
}

//+------------------------------------------------------------------+
//| Custor indicator deinitialization function                       |
//+------------------------------------------------------------------+
int deinit()
{
    // ???? ????? ?????? ??????
    return(0);
}

//+------------------------------------------------------------------+
//| ?????????? ???????                                               |
//+------------------------------------------------------------------+
double WMA(int x, int p)
{
    return(iMA(NULL, 0, p, 0, method, price, x));
}

//+------------------------------------------------------------------+
//| Custom indicator iteration function                              |
//+------------------------------------------------------------------+
int start()
{
    int counted_bars = IndicatorCounted();

    if(counted_bars < 0)
        return(-1);

    int x = 0;
    int p = MathSqrt(period);
    int e = Bars - counted_bars + period + 1;

    double vect[], trend[];

    if(e > Bars)
        e = Bars;

    ArrayResize(vect, e);
    ArraySetAsSeries(vect, true);
    ArrayResize(trend, e);
    ArraySetAsSeries(trend, true);

    for(x = 0; x < e; x++)
    {
        vect[x] = 2*WMA(x, period/2) - WMA(x, period);
 //       Print("Bar date/time: ", TimeToStr(Time[x]), " close: ", Close[x], " vect[", x, "] = ", vect[x], " 2*WMA(p/2) = ", 2*WMA(x, period/2), " WMA(p) = ",  WMA(x, period));
    }

    for(x = 0; x < e-period; x++)

        ExtMapBuffer[x] = iMAOnArray(vect, 0, p, 0, method, x);

    for(x = e-period; x >= 0; x--)
    {
        trend[x] = trend[x+1];
        if (ExtMapBuffer[x]> ExtMapBuffer[x+1]) trend[x] =1;
        if (ExtMapBuffer[x]< ExtMapBuffer[x+1]) trend[x] =-1;

    if (trend[x]>0)
    { Uptrend[x] = ExtMapBuffer[x];
      if (trend[x+1]<0) Uptrend[x+1]=ExtMapBuffer[x+1];
      Dntrend[x] = EMPTY_VALUE;
    }
    else
    if (trend[x]<0)
    {
      Dntrend[x] = ExtMapBuffer[x];
      if (trend[x+1]>0) Dntrend[x+1]=ExtMapBuffer[x+1];
      Uptrend[x] = EMPTY_VALUE;
    }

    //Print( " trend=",trend[x]);
    }

    return(0);
}
//+------------------------------------------------------------------+
Comments