Slope Direction Line_002
Download script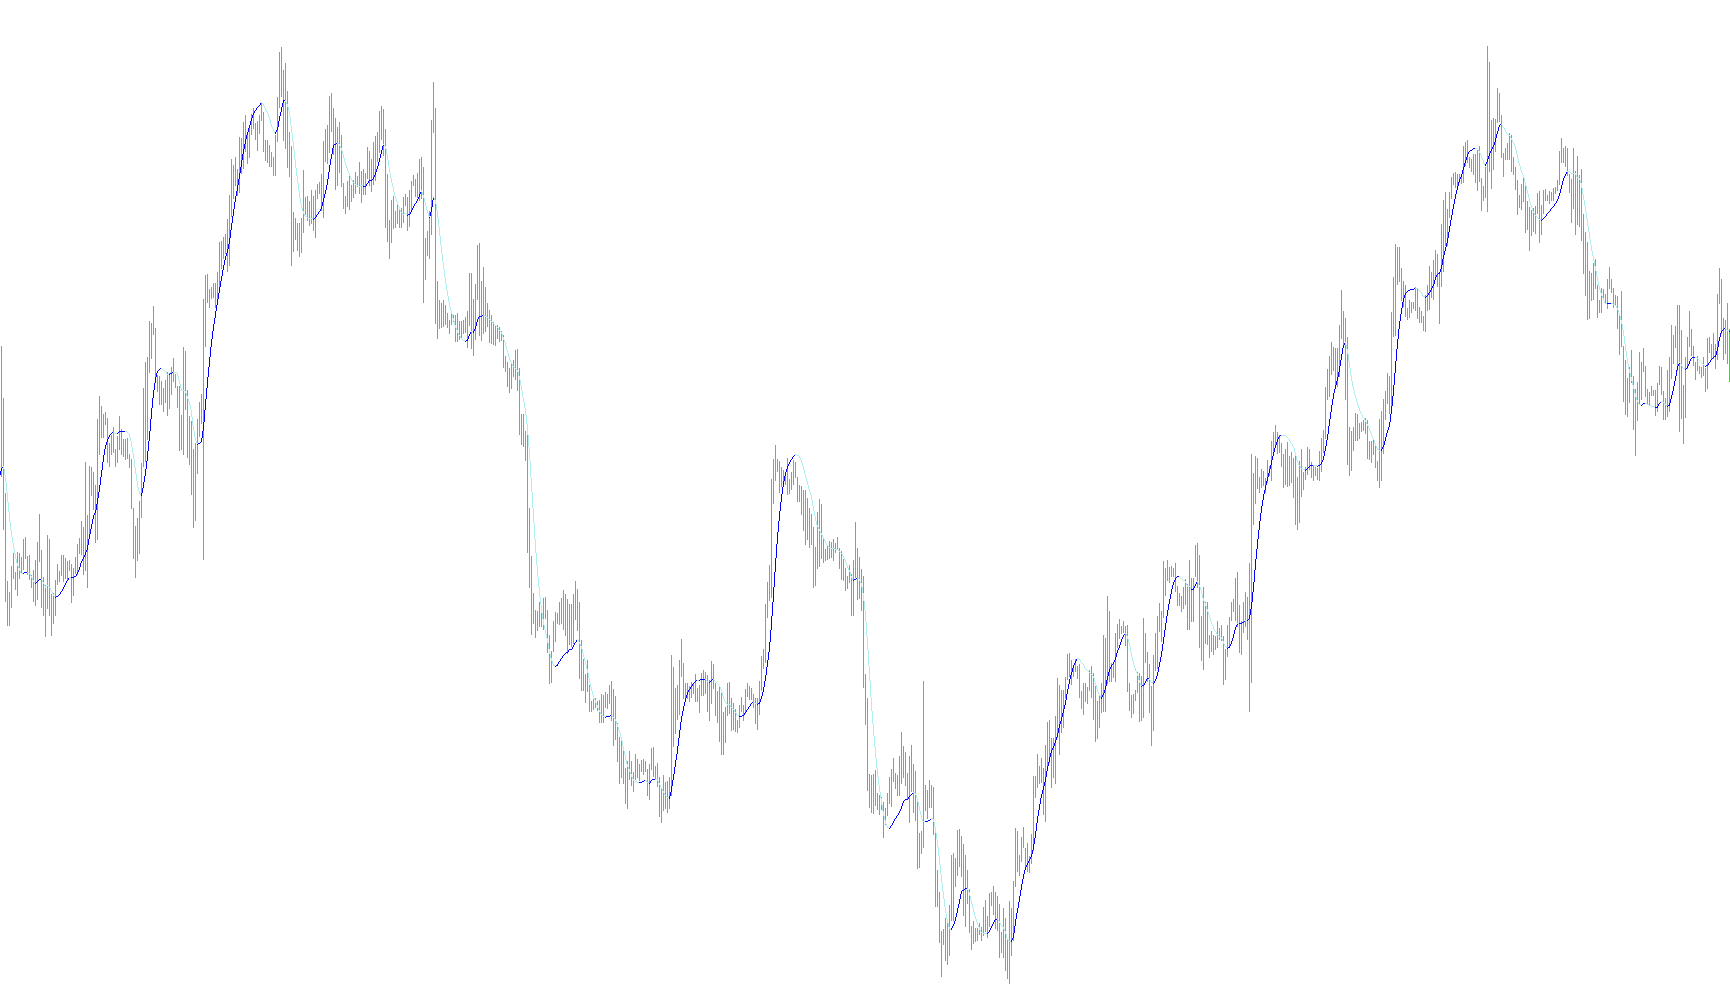
This tool is designed to help traders visualize and identify the prevailing direction of the market by analyzing "trend slopes." Instead of just looking at raw price movements, which can often be noisy and distracting, this script processes data to create a smoother representation of the market's momentum.
How the Logic Works
1. Data Smoothing & Vector Calculation The script begins by calculating moving averages based on specific timeframes defined by the user. It uses a mathematical formula to create a "vector." By comparing two different types of moving averages (one shorter and one longer), it identifies the underlying velocity of the price. This helps filter out minor market fluctuations to reveal the broader trend.
2. Slope Analysis Once the vector is established, the script applies a second layer of smoothing. This results in a primary indicator line on your chart. This line acts as a "slope" guide; it follows the general path of the price but with less volatility, making it easier to see whether the market is structurally moving up or down.
3. Trend Detection and Visualization The core logic then monitors the direction of this slope:
- Uptrend Identification: When the current slope is higher than the previous one, the script recognizes an upward movement. It highlights these sections on the chart (typically in a distinct color like Blue or Orange depending on settings).
- Downtrend Identification: Conversely, when the slope begins to tilt downward compared to the previous data point, it identifies a bearish trend and marks it accordingly (typically in Red).
Key Features for the User
- Visual Clarity: Rather than forcing you to guess where a trend ends, the script explicitly separates "Up" and "Down" movements onto different visual paths. This makes it easier to see exactly when a shift in momentum occurs.
- Customizable Sensitivity: You can adjust the "Period" setting to determine how many bars of data the script looks at. A lower period makes the indicator more responsive to quick changes, while a higher period provides a much smoother, long-term trend overview.
- Trend Continuity: The logic is designed to "fill in" the trend. If a trend is moving steadily in one direction, the indicator maintains that visual state until the slope clearly crosses the threshold into the opposite direction.
In summary, this script acts as a momentum filter. It takes complex price data, calculates its velocity, determines the angle of that movement, and translates it into clear visual signals of whether the market is trending up or down.
//+------------------------------------------------------------------+
//| HMA.mq4
//| Copyright © 2006 WizardSerg <wizardserg@mail.ru>, ?? ??????? ForexMagazine #104
//| wizardserg@mail.ru
//| Revised by IgorAD,igorad2003@yahoo.co.uk |
//| Personalized by iGoR AKA FXiGoR for the Trend Slope Trading method (T_S_T)
//| Link:
//| contact: thefuturemaster@hotmail.com
//+------------------------------------------------------------------+
#property copyright "MT4 release WizardSerg <wizardserg@mail.ru>, ?? ??????? ForexMagazine #104"
#property link      "wizardserg@mail.ru"

#property indicator_chart_window
#property indicator_buffers 3
#property indicator_color2 Blue
#property indicator_color3 Red
#property indicator_color1 Orange
#property indicator_width1 1
#property indicator_width2 1
#property indicator_width3 1

//---- input parameters
extern int       period=20;
extern int       method=1;                         // MODE_SMA
extern int       price=0;                          // PRICE_CLOSE
//---- buffers
double Uptrend[];
double Dntrend[];
double ExtMapBuffer[];
double buff[];


//+------------------------------------------------------------------+
//| Custom indicator initialization function                         |
//+------------------------------------------------------------------+
int init()
{
    IndicatorBuffers(3);
    SetIndexBuffer(1, Uptrend);
    //ArraySetAsSeries(Uptrend, true);
    SetIndexBuffer(2, Dntrend);
    //ArraySetAsSeries(Dntrend, true);
    //SetIndexBuffer(2, ExtMapBuffer);
    //ArraySetAsSeries(Uptrend, true);
    SetIndexBuffer(0, ExtMapBuffer);
    ArraySetAsSeries(ExtMapBuffer, true);

    SetIndexStyle(0,DRAW_LINE);
    SetIndexStyle(1,DRAW_LINE);
    SetIndexStyle(2,DRAW_LINE);

    IndicatorShortName("Slope Direction Line("+period+")");
    return(0);
}

//+------------------------------------------------------------------+
//| Custor indicator deinitialization function                       |
//+------------------------------------------------------------------+
int deinit()
{
    // ???? ????? ?????? ??????
    return(0);
}

//+------------------------------------------------------------------+
//| ?????????? ???????                                               |
//+------------------------------------------------------------------+
double WMA(int x, int p)
{
    return(iMA(NULL, 0, p, 0, method, price, x));
}

//+------------------------------------------------------------------+
//| Custom indicator iteration function                              |
//+------------------------------------------------------------------+
int start()
{
    int counted_bars = IndicatorCounted();

    if(counted_bars < 0)
        return(-1);

    int x = 0;
    int p = MathSqrt(period);
    int e = Bars - counted_bars + period + 1;

    double vect[], trend[];

    if(e > Bars)
        e = Bars;

    ArrayResize(vect, e);
    ArraySetAsSeries(vect, true);
    ArrayResize(trend, e);
    ArraySetAsSeries(trend, true);

    for(x = 0; x < e; x++)
    {
        vect[x] = 2*WMA(x, period/2) - WMA(x, period);
 //       Print("Bar date/time: ", TimeToStr(Time[x]), " close: ", Close[x], " vect[", x, "] = ", vect[x], " 2*WMA(p/2) = ", 2*WMA(x, period/2), " WMA(p) = ",  WMA(x, period));
    }

    for(x = 0; x < e-period; x++)

        ExtMapBuffer[x] = iMAOnArray(vect, 0, p, 0, method, x);

    for(x = e-period; x >= 0; x--)
    {
        trend[x] = trend[x+1];
        if (ExtMapBuffer[x]> ExtMapBuffer[x+1]) trend[x] =1;
        if (ExtMapBuffer[x]< ExtMapBuffer[x+1]) trend[x] =-1;

    if (trend[x]>0)
    { Uptrend[x] = ExtMapBuffer[x];
      if (trend[x+1]<0) Uptrend[x+1]=ExtMapBuffer[x+1];
      Dntrend[x] = EMPTY_VALUE;
    }
    else
    if (trend[x]<0)
    {
      Dntrend[x] = ExtMapBuffer[x];
      if (trend[x+1]>0) Dntrend[x+1]=ExtMapBuffer[x+1];
      Uptrend[x] = EMPTY_VALUE;
    }
    buff[x] = trend[x];

    //Print( " trend=",trend[x]);
    }

    return(0);
}
//+------------------------------------------------------------------+
Comments