HVR
Download script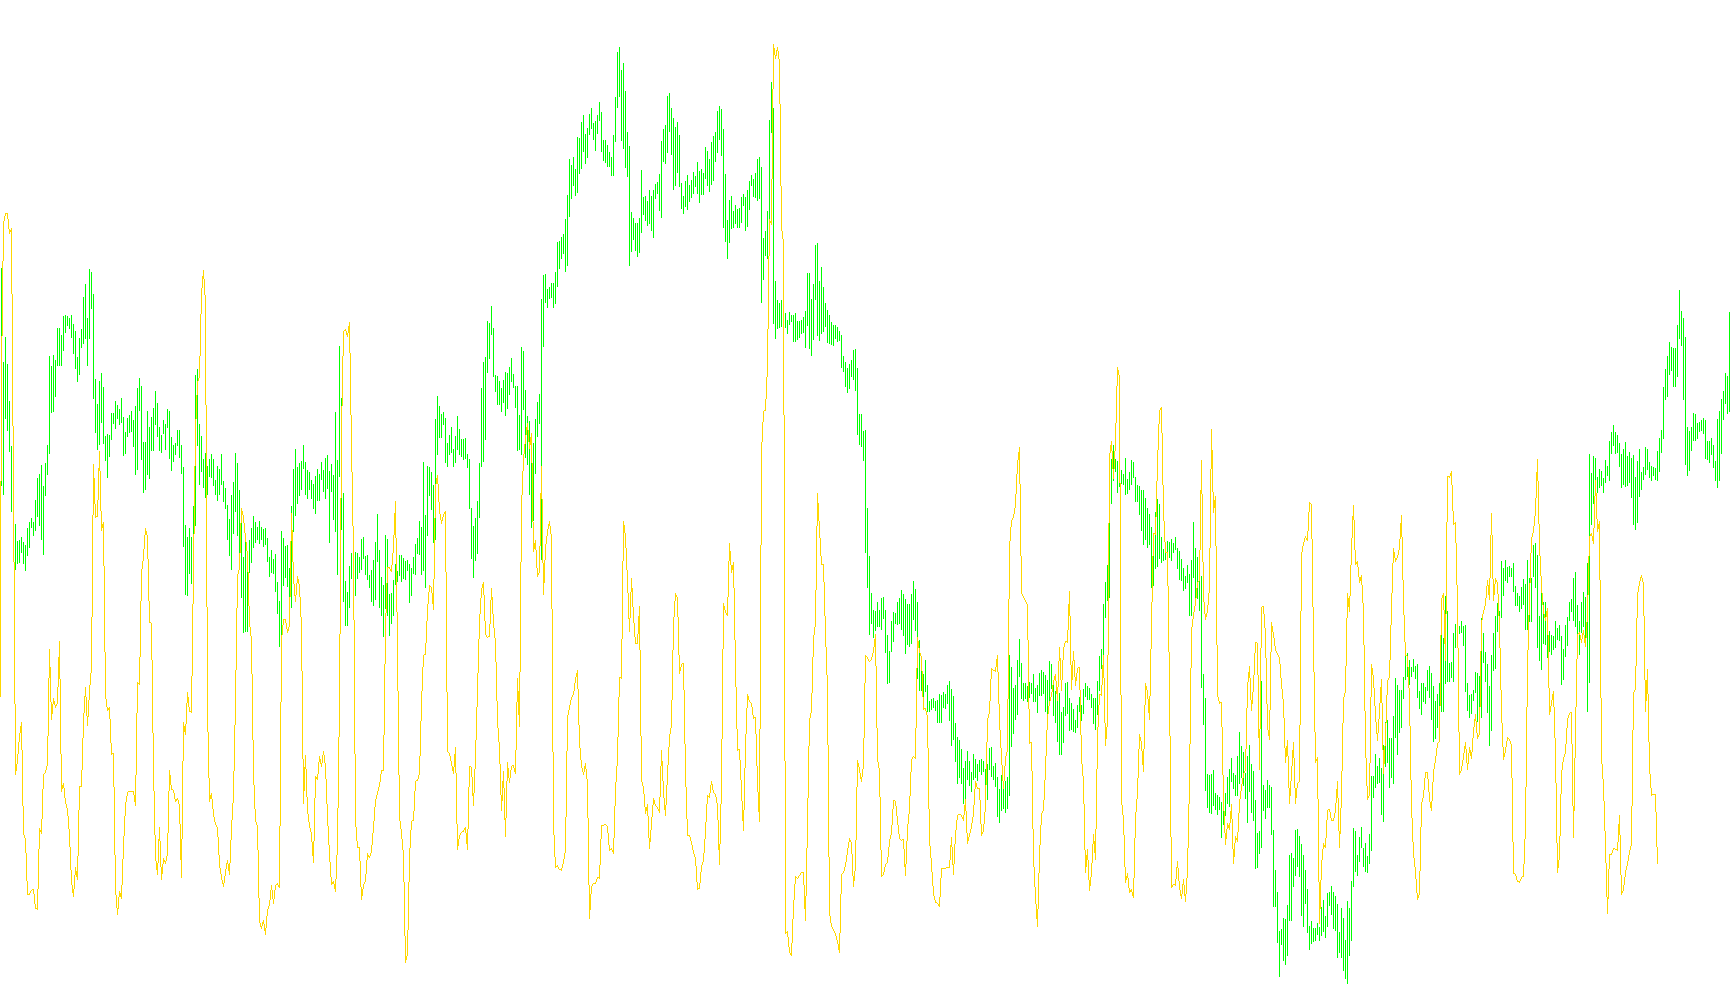
This script is designed as a technical analysis tool for trading platforms, specifically used to measure and visualize market volatility over different time horizons. It functions by comparing the "turbulence" of price movements in the very近期 (short-term) against the broader market trends (long-term).
Core Logic Overview
The indicator operates by analyzing the relationship between two specific timeframes: a short 6-bar window and a longer 100-bar window. Instead of looking at simple price changes, it calculates the mathematical "variance"—essentially measuring how much the price deviates from its average movement within those periods.
How it Works Step-by-Step
- Price Change Analysis: The tool first looks at each individual price bar and calculates the logarithmic change from one bar to the next. Using logarithms helps ensure that the scale of price movements remains consistent regardless of whether the asset is trading at a high or low value.
- Establishing Averages: It creates two distinct averages:
- A short-term average based on the last 6 bars.
- A long-term average based on the last 100 bars.
- Calculating Volatility (Variance): For both of these timeframes, the tool calculates how much the individual price changes "swing" away from their respective averages. It squares these differences to emphasize larger movements and then takes a square root to bring the numbers back into a usable scale. This process identifies the intensity of the market's current movement.
- The Final Comparison: The final value displayed on your chart is a ratio. It divides the short-term volatility by the long-term volatility.
What this means for the user
By comparing these two types of volatility, the tool helps identify "unusual" market behavior. Because it focuses on the ratio between short-term and long-term swings, it highlights moments where the current price action is significantly more aggressive or calmer than what has been observed over the past 100 bars. This provides a visual cue regarding the intensity of the current market environment.
//+------------------------------------------------------------------+
//|                                                          HVR.mq4 |
//|      Copyright © 2005, Albert,(idea and code into MQL2 - podval) |
//|                                                                  |
//+------------------------------------------------------------------+
#property indicator_separate_window
//----
#property indicator_minimum 0
#property indicator_maximum 3
#property indicator_buffers 3
//----
#property indicator_color1 Red
#property indicator_color2 Red
//+------------------------------------------------------------------+
//|                                                                  |
//+------------------------------------------------------------------+
double  hv6=0,
   hv100=0,
   len=150,
   prevBars=0,
   mean6=0,
   mean100=0;
//----
int    shift=0, i=0;
double
   x6[6],
   x100[100];
//---- buffers
double HVRBuffer[];
double ExtMapBuffer[];
int ExtCountedBars=0;
int Barsi=1000;
//+------------------------------------------------------------------+
//| Custom indicator initialization function                         |
//+------------------------------------------------------------------+
int init()
  {
//---- 2 additional buffers are used for counting.
   IndicatorBuffers(2);
   SetIndexBuffer(0,HVRBuffer);
//---- indicator line
   SetIndexStyle(0,DRAW_LINE);
   SetIndexStyle(1,DRAW_LINE);
//---- name for DataWindow and indicator subwindow label
   IndicatorShortName("HVR");
   SetIndexLabel(0,"HVR");
//----
//----
   return(0);
  }
//+------------------------------------------------------------------+
//|                                                                  |
//+------------------------------------------------------------------+
int start()
  {
   if (prevBars==Barsi) return(0);
   prevBars=Barsi;
   for(shift=0; shift<=Barsi-1-len; shift++)
     {
      for(i =0; i<=5; i++)
        {
         x6[i]= MathLog(Close[shift+i]/Close[shift+i+1]);
        }
      for(i=0; i<=99; i++)
        {
         x100[i]=MathLog(Close[shift+i]/Close[shift+i+1]);
        }
      mean6=0;
      for(i =0; i<=5; i++)
        {
         mean6=mean6 + x6[i];
        }
      mean6=mean6/6;
      mean100=0;
      for(i=0; i<=99; i++)
        {
         mean100=mean100 + x100[i];
        }
      mean100=mean100/100;
      hv6=0;
      for(i =0; i<=5; i++)
        {
         hv6=hv6 + (x6[i] - mean6)*(x6[i] - mean6);
        }
      hv6=MathSqrt(hv6/5)*7.211102550927978586238442534941;
      hv100=0;
      for(i=0; i<=99; i++)
         hv100=hv100 + (x100[i] - mean100)*(x100[i] - mean100);
      hv100=MathSqrt(hv100/99)*7.211102550927978586238442534941;
      HVRBuffer[shift]= hv6/hv100;
     }
  }
//+------------------------------------------------------------------+
Comments