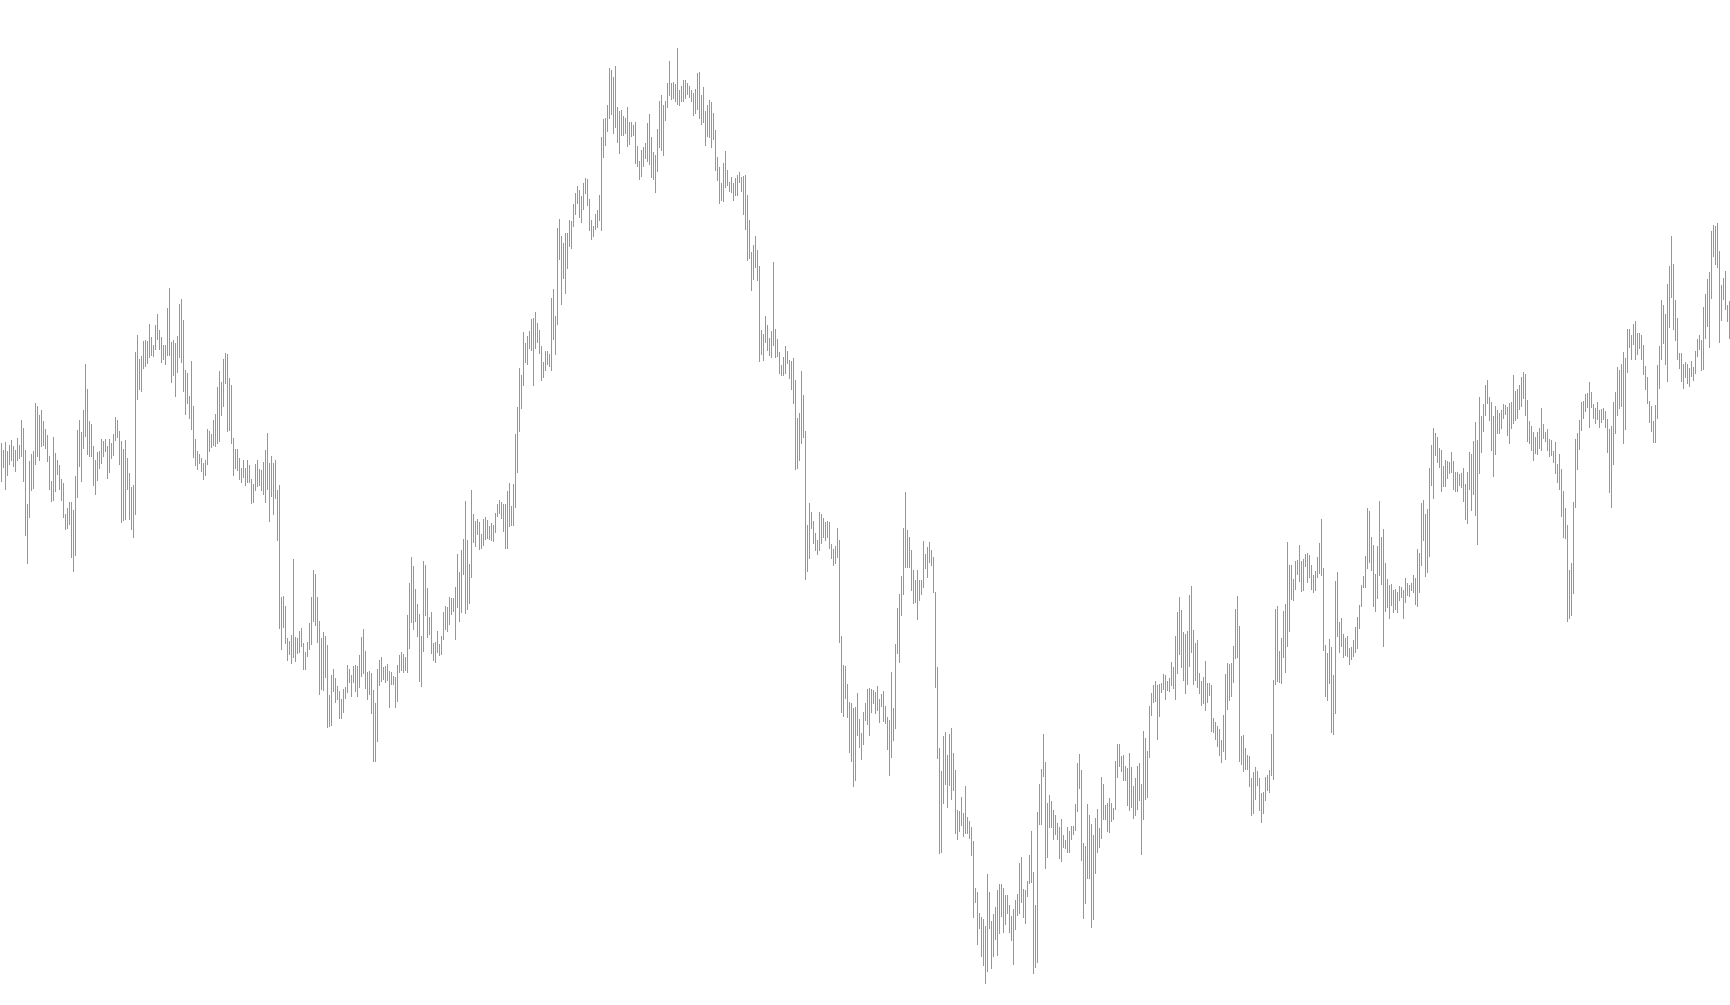
This custom indicator is designed to provide traders with a comprehensive multi-timeframe perspective of market trends directly on their charts. Instead of forcing a trader to constantly switch between different time intervals to see the "big picture," this tool synchronizes five distinct timeframes into a single visual display.
How It Works
The core logic of this script revolves around tracking the Simple Moving Average (SMA) across five specific market periods simultaneously. For every point of data on your current chart, the indicator calculates the average price based on the following intervals:
- 30-Minute Chart
- 1-Hour Chart
- 4-Hour Chart
- Daily Chart
- Weekly Chart
Key Features and Behavior
- Multi-Timeframe Synchronization: The indicator pulls data from all five timeframes (from 30 minutes up to a full week) and maps them onto your current view. This allows you to see how the immediate price action relates to much larger, long-term trends at a single glance.
- Moving Average Smoothing: It utilizes a short moving average period (2) based on the opening prices of each respective timeframe. By focusing on the "Open" price, the indicator aims to capture the foundational sentiment of each time period rather than being distracted by minor fluctuations within the candle.
- Visual Representation: The script generates five distinct lines on your chart, each representing one of the timeframes mentioned above. Because each line is color-coded differently (Red, White, Aqua, LightGreen, and DodgerBlue), it is easy to distinguish between short-term momentum and long-term structural trends.
- Automated Data Processing: The logic is designed to run automatically across the chart history, calculating these averages for 100 bars back from the current price point to ensure that the visual data is readily available for analysis as soon as you load the chart.
Summary for the Trader
Think of this tool as a "telescope" for your trading platform. While your main chart shows you what is happening right now, these five lines show you what is happening in the surrounding environment—from the next hour to the next month. It helps identify "confluence," where multiple timeframes align in the same direction, providing a clearer picture of market health and potential trend strength.
//+------------------------------------------------------------------+
//| 5 Min RSI 12-period qual INDICATOR                               |
//+------------------------------------------------------------------+
#property copyright "Ron T"
#property link      "http://www.lightpatch.com"

#property indicator_chart_window
#property indicator_buffers 5

#property indicator_color1 Red
#property indicator_color2 White
#property indicator_color3 Aqua
#property indicator_color4 LightGreen
#property indicator_color5 DodgerBlue


//---- buffers
double Buffer0[];
double Buffer1[];
double Buffer2[];
double Buffer3[];
double Buffer4[];


//+------------------------------------------------------------------+
//| Custom indicator initialization function                         |
//|------------------------------------------------------------------|

int init()
  {

   // 233 up arrow
   // 234 down arrow
   // 159 big dot
   // 158 little dot
   // 168 open square
   // 120 box with X

   SetIndexStyle(0,DRAW_LINE);
   SetIndexBuffer(0, Buffer0);

   SetIndexStyle(1,DRAW_LINE);
   SetIndexBuffer(1, Buffer1);

   SetIndexStyle(2,DRAW_LINE);
   SetIndexBuffer(2, Buffer2);

   SetIndexStyle(3,DRAW_LINE);
   SetIndexBuffer(3, Buffer3);

   SetIndexStyle(4,DRAW_LINE);
   SetIndexBuffer(4, Buffer4);

   return(0);
  }


//+------------------------------------------------------------------+
//| Custor indicator deinitialization function                       |
//+------------------------------------------------------------------+
int deinit()
  {
   int i;

   for( i=0; i<Bars; i++ ) Buffer0[i]=0;
   for( i=0; i<Bars; i++ ) Buffer1[i]=0;
   for( i=0; i<Bars; i++ ) Buffer2[i]=0;
   for( i=0; i<Bars; i++ ) Buffer3[i]=0;
   for( i=0; i<Bars; i++ ) Buffer4[i]=0;

   return(0);
  }


//+------------------------------------------------------------------+
//| Custom indicator iteration function                              |
//+------------------------------------------------------------------+


int start()
  {
   int      pos=Bars-100; // leave room for moving average periods
   int      ctr=0;

   double  ma0, ma1, ma2, ma3, ma4;

   double p=Point();

   while(pos>=0)
     {

      // so we're on a HOURLY chart, and we're going to calculate
      // every tick for H1, every 4th tick for H4 and
      // every 24th tick for D1

      ma0= iMA(Symbol(),PERIOD_M30,2 ,0,PRICE_OPEN,MODE_SMA,pos);
      ma1= iMA(Symbol(),PERIOD_H1 ,2 ,0,PRICE_OPEN,MODE_SMA,pos);
      ma2= iMA(Symbol(),PERIOD_H4 ,2 ,0,PRICE_OPEN,MODE_SMA,pos);
      ma3= iMA(Symbol(),PERIOD_D1 ,2 ,0,PRICE_OPEN,MODE_SMA,pos);
      ma4= iMA(Symbol(),PERIOD_W1 ,2 ,0,PRICE_OPEN,MODE_SMA,pos);

      Buffer0[pos]=ma0;
      Buffer1[pos]=ma1;
      Buffer2[pos]=ma2;
      Buffer3[pos]=ma3;
      Buffer4[pos]=ma4;

 	   pos--;
     }

   return(0);
  }
//+------------------------------------------------------------------+
Comments