iAvgVol_v2
Download script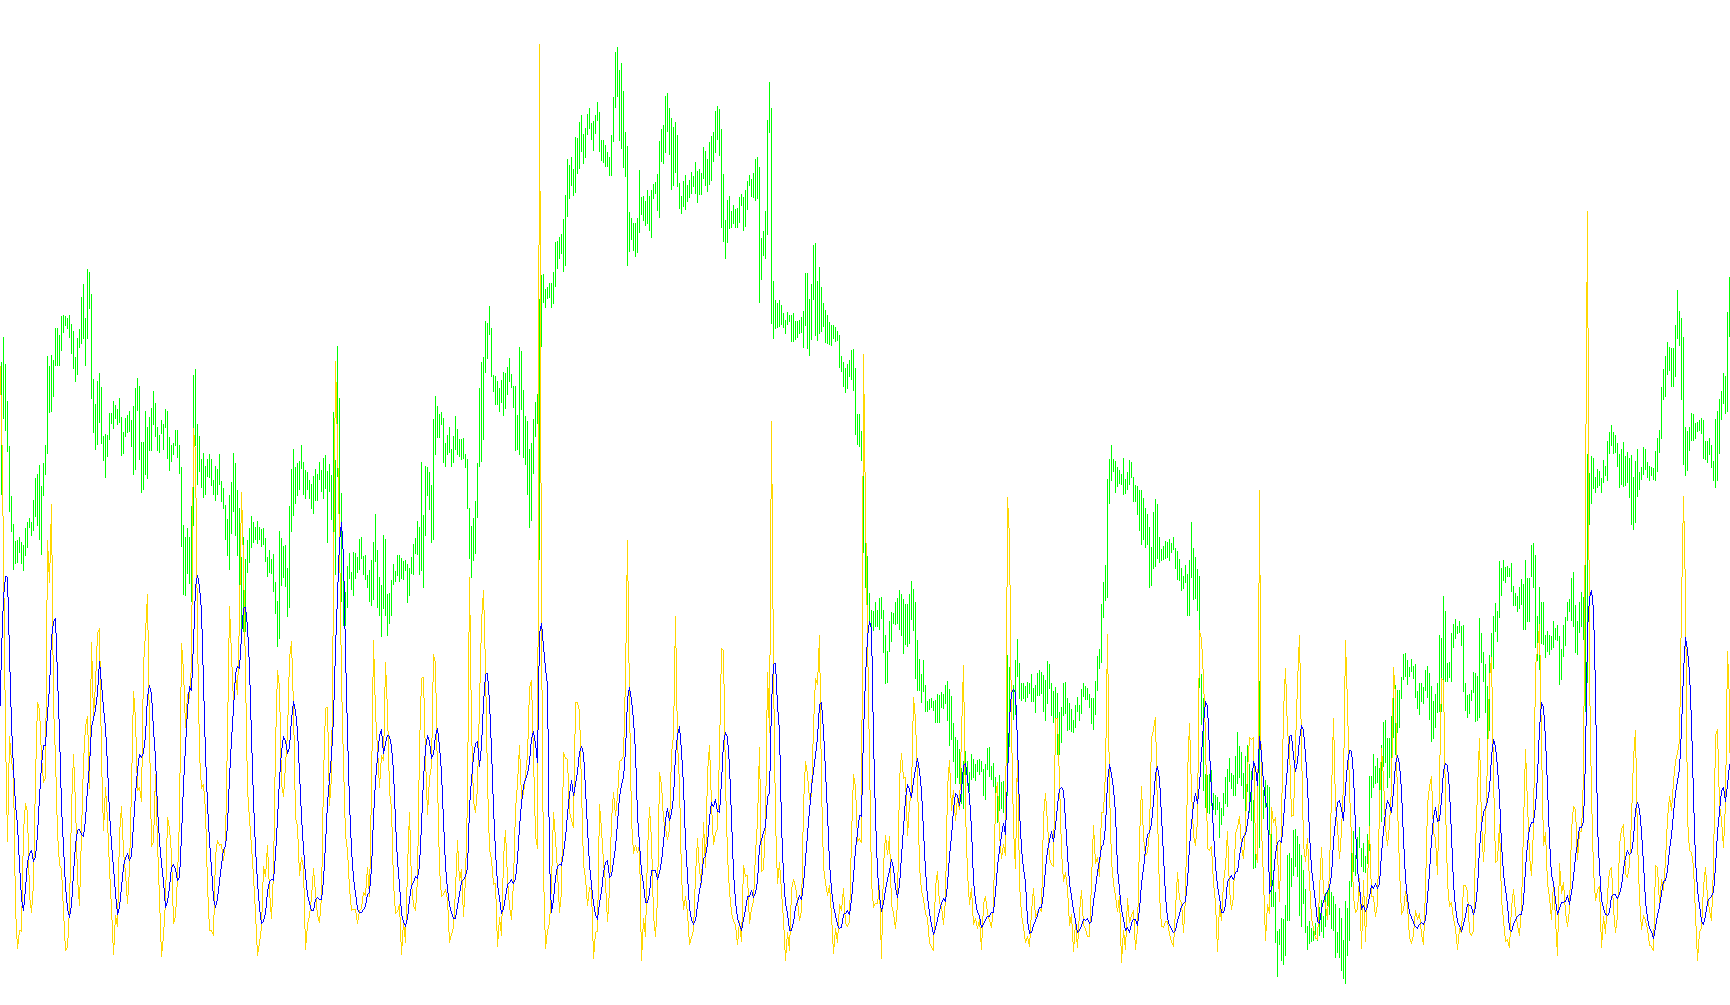
This tool is designed to provide traders with a clear visual representation of trading activity by comparing current market volume against its historical average. By analyzing these two data points simultaneously, it helps identify whether the current momentum in price is supported by significant participation or if it is occurring on unusually low activity.
Core Functionality
The script generates two distinct lines on a separate indicator window:
- Current Volume: This tracks the actual amount of trading activity occurring during each specific price bar. It shows you exactly how much "work" is being done in the market at any given moment.
- Average Volume: This represents a moving benchmark. It looks back over a user-defined period (set by default to 5 bars) and calculates the average volume across that timeframe.
How the Logic Works
The script operates by performing a continuous calculation as new price data enters the chart:
- Data Collection: For every new candle, the tool identifies the current volume of trade.
- Historical Comparison: It then reaches back into the recent history to gather the volume totals of the preceding bars (based on the period you choose).
- Averaging: It adds these historical totals together and divides them by the number of bars in your chosen period. This creates a "baseline" of what normal activity looks like.
- Visual Output: The tool plots both the current live volume and this calculated average as two separate lines.
Practical Application
By observing the relationship between these two lines, you can gauge market sentiment:
- When the Current Volume line rises significantly above the Average Volume line, it suggests a surge in interest, often indicating a strong move driven by high conviction from many participants.
- Conversely, if price is moving but the Current Volume remains below the Average Volume, it may suggest that the current trend lacks "fuel" or support, potentially signaling a weaker move or a lack of interest from large traders.
Miscellaneous
14
Views
0
Downloads
0
Favorites
iAvgVol_v2
//+------------------------------------------------------------------+
//|                                                      iAvgVol.mq4 |
//|                                           Copyright © 2005, Anri |
//|                                    http://tradestation.narod.ru/ |
//+------------------------------------------------------------------+
#property copyright "Copyright © 2005, Anri"
#property link      "http://tradestation.narod.ru/"

#property indicator_separate_window
#property indicator_buffers 2
#property indicator_color1 Blue
#property indicator_color2 Red
//---- input parameters
extern int nPeriod = 5;
//---- buffers
double ExtMapBuffer1[];
double ExtMapBuffer2[];
//+------------------------------------------------------------------+
//| Custom indicator initialization function                         |
//+------------------------------------------------------------------+
int init()
  {
   string short_name;
//---- indicators
   SetIndexStyle(0, DRAW_LINE);
   SetIndexBuffer(0, ExtMapBuffer1);
   SetIndexStyle(1, DRAW_LINE);
   SetIndexBuffer(1, ExtMapBuffer2);
//---- name for DataWindow and indicator subwindow label
   short_name = "iAvgVol(" + nPeriod + ")";
   IndicatorShortName(short_name);
   SetIndexLabel(0, "Volume");
   SetIndexLabel(1, "AvgVolume");
//----
   return(0);
  }
//+------------------------------------------------------------------+
//| Custor indicator deinitialization function                       |
//+------------------------------------------------------------------+
int deinit()
  {
//----
   return(0);
  }
//+------------------------------------------------------------------+
//| Custom indicator iteration function                              |
//+------------------------------------------------------------------+
int start()
  {
   int counted_bars = IndicatorCounted();
   int    i, shift;
   double nSum;
//---- initial zero
   if(counted_bars < 1) // åñëè òåêóùèé áàð ìåíüøå åäèíèöû, óñòàíàâëèâàåì âñå â íóëè
     {
       for(i = 1; i <= 0; i++)
         {
           ExtMapBuffer1[Bars-i] = 0;
           ExtMapBuffer2[Bars-i] = 0;
         }
     }
//---- âû÷èñëåíèÿ
   for(shift = Bars - 1; shift >= 0; shift--)
     {
       nSum = Volume[shift];
       ExtMapBuffer1[shift] = nSum;
       if((nPeriod > 0) && (shift < (Bars - nPeriod - 1)))
         {
           for(i = nPeriod - 1; i >= 1; i--)
             {
               nSum = nSum + ExtMapBuffer1[shift+i];
	            }
	          nSum = nSum / nPeriod;
	        }
       ExtMapBuffer2[shift] = nSum;
     }
   return(0);
  }
//+------------------------------------------------------------------+
Comments