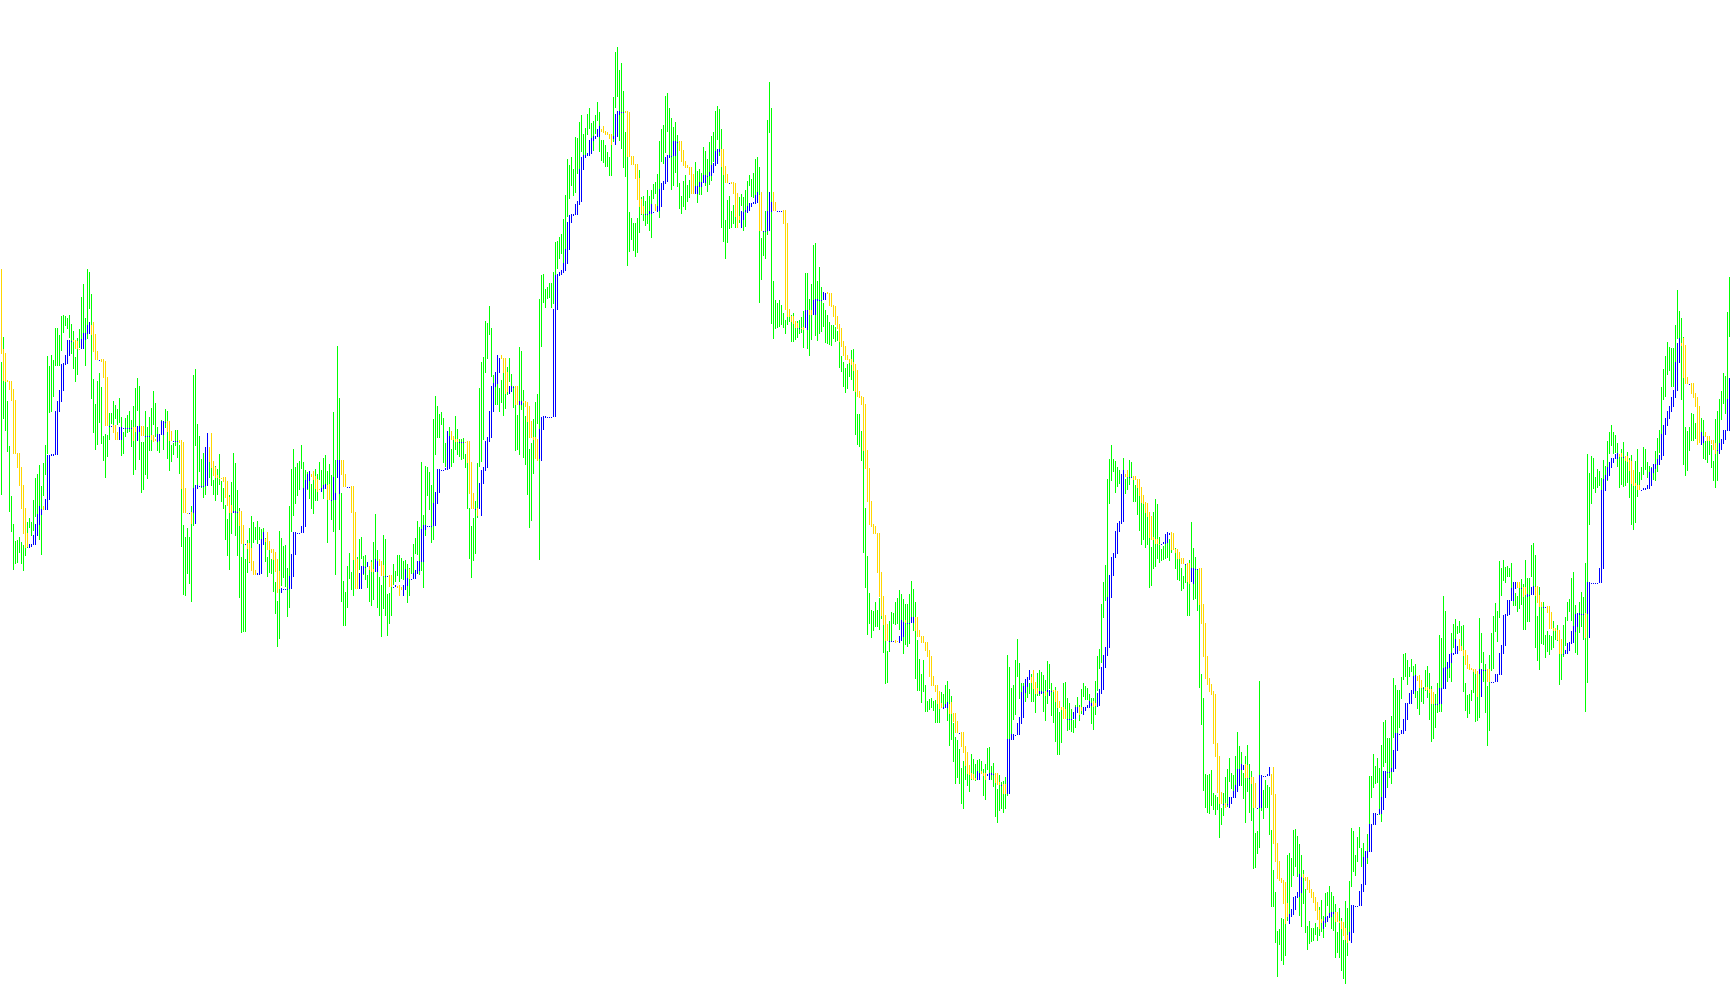
Trend Manager Overview
The Trend Manager is a technical analysis tool designed to help traders identify the current direction of the market by analyzing price extremes over specific timeframes. Instead of relying on complex mathematical noise, this tool focuses on the relationship between recent historical "highs" and "lows" to determine whether the market is showing bullish, bearish, or neutral momentum.
How the Logic Works
The core functionality of the script revolves around calculating two distinct price levels (referred to as Span A and Span B) and comparing them against each other:
- Price Range Calculation: For every specific point in time, the tool looks back at a defined number of historical bars (determined by the user). It identifies the highest peak and the lowest valley within that window.
- The Midpoint Value: The script then calculates the mathematical average of that high and low point. This represents the "center" of the price action for that period.
- The Comparison Engine: This is where the trend is identified. The tool compares the current midpoint (Span A) with a previous midpoint from a slightly earlier timeframe (Span B).
Market Signals
By comparing these two midpoints, the tool categorizes the market into three distinct states:
- Buy Signal: If the current midpoint is higher than the previous one, it indicates that the average price range has shifted upward, suggesting a bullish trend.
- Sell Signal: If the current midpoint is lower than the previous one, it indicates that the average price range has shifted downward, suggesting a bearish trend.
- Neutral: If both midpoints are identical, the tool identifies no clear change in direction, signaling a period of consolidation or equilibrium.
Visual Representation
The script visualizes these calculations directly on your trading chart using histograms. These visual cues allow you to see at a glance how the trend is evolving over time, making it easier to react to shifts in market momentum without having to manually calculate price extremes.
// Trend Manager.mq4
// Based on indicator sold at traderstradingsystem.com

#property indicator_chart_window
#property indicator_buffers 2
#property indicator_color1 Red
#property indicator_color2 Blue

extern int TM_Period = 7;
extern int TM_Shift = 2;

double SpanA_Buffer[];
double SpanB_Buffer[];
int a_begin;

int init()
{
   a_begin=TM_Shift;
   SetIndexStyle(0,DRAW_HISTOGRAM,STYLE_SOLID);
   SetIndexBuffer(0,SpanB_Buffer);
   SetIndexDrawBegin(0,TM_Period+a_begin-1);
   SetIndexLabel(0,"TM_Period+");
   SetIndexStyle(1,DRAW_HISTOGRAM,STYLE_SOLID);
   SetIndexBuffer(1,SpanA_Buffer);
   SetIndexDrawBegin(1,TM_Period+a_begin-1);
   SetIndexLabel(1,"TM_Period");

   return(0);
}

int start()
{
   int    i,k;
   int    counted_bars=IndicatorCounted();
   double high,low,price;
   string sColor;

   if(Bars<=TM_Period) return(0);
   if(counted_bars<1)
   {
      for(i=1;i<=TM_Period;i++)
      {
         SpanA_Buffer[Bars-i]=0;
         SpanB_Buffer[Bars-i]=0;
      }
   }

   // JUSTIN NOTES
   // BASICALLY, I THINK THE FORMULA IS TO GO BACK 7 BARS, SUM THE HIGH LOW, DIVIDE BY 2
   // THEN GET THAT SAME VALUE, BUT 2 BARS PREVIOUSLY, IF THE FIRST VALUE IS GREATER IT'S A BUY
   // OTHER WISE IT'S A SELL, IF EQUAL, NEAUTRAL

   i=Bars-TM_Period;
   if(counted_bars>TM_Period) i=Bars-counted_bars-1;
   while(i>=0)
   {
      high=High[i]; low=Low[i]; k=i-1+TM_Period;
      while(k>=i)
      {
         price=High[k];
         if(high<price) high=price;
         price=Low[k];
         if(low>price)  low=price;
         k--;
      }
      SpanA_Buffer[i]  = (high+low)/2.0;
      SpanB_Buffer[i]  = SpanA_Buffer[i+TM_Shift];

      //Print("Span A Buffer[", i, "] = ", (high+low)/2.0);
      //Print("Span B Buffer[", i, "] = ", SpanA_Buffer[i+TM_Shift]);

      //Print("Span A Price = ", SpanA_Buffer[Bars-TM_Period], " -- Span B Price = ", SpanB_Buffer[Bars-TM_Period]);

      if ( SpanA_Buffer[i] > SpanB_Buffer[i] )
      {
         sColor = "BUY";
      }
      else if ( SpanA_Buffer[i] < SpanB_Buffer[i] )
      {
         sColor = "SELL";
      }
      else
      {
         sColor = "NEUTRAL";
      }


      Print(sColor, " -- Bar = ", i, " -- Span A Price (Blue) = ", SpanA_Buffer[i], " -- Span B Price (Red) = ", SpanB_Buffer[i]);

      i--;
   }

   return(0);
}
Comments