iFXAnalyser_H4_v1
Download script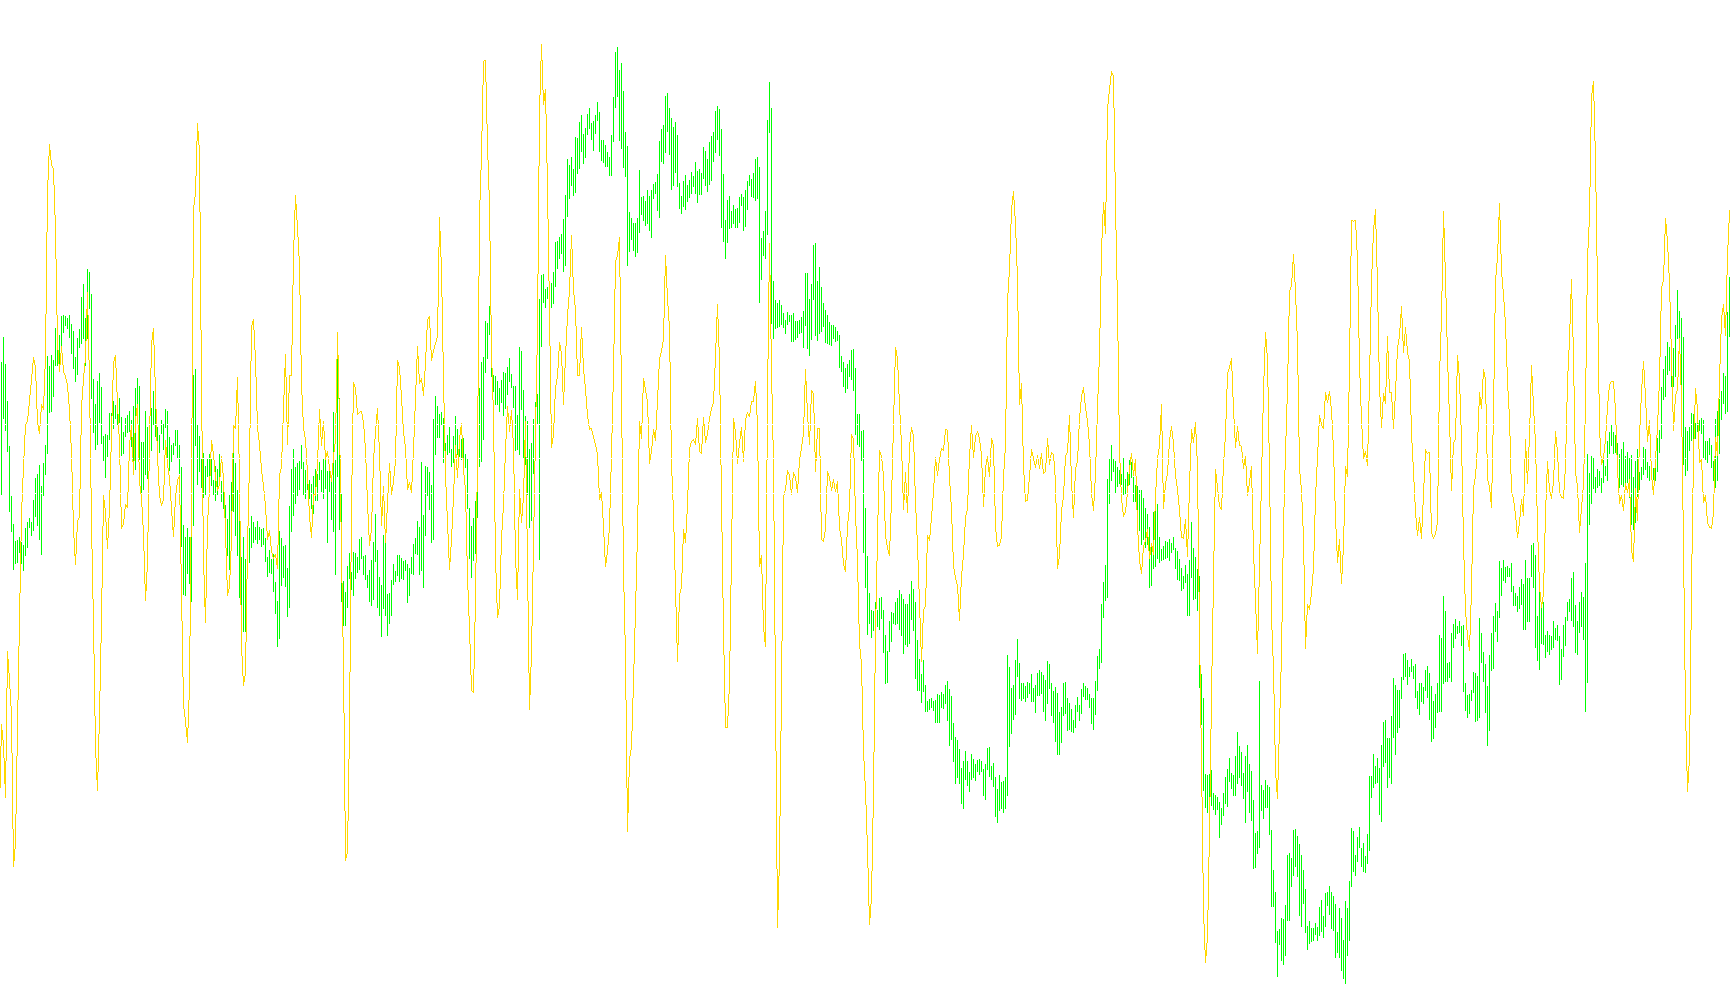
This tool is designed to provide traders with a visual analysis of market momentum by tracking the relationship between two different moving averages. Instead of looking at price directly, it focuses on the "gap" and the "speed" at which that gap changes over time.
Core Logic Overview
The script operates by calculating the difference between a fast-moving average (which reacts quickly to price changes) and a slow-moving average (which represents the broader trend). By comparing these two, the tool helps identify whether market momentum is accelerating, slowing down, or reversing.
Key Components of the Analysis
-
Divergence Tracking: The primary logic measures the distance between the fast and slow moving averages at any given moment. When this value increases, it suggests that the short-term price action is pulling away from the long-term average. This "divergence" helps traders see how much "stretch" there is in the current trend.
-
Slope Analysis: Beyond just measuring the distance, the tool calculates the slope (the rate of change). It looks at the difference between the current divergence and the previous one. This tells you if the gap is widening faster, narrowing, or staying constant.
-
Acceleration Monitoring: By tracking how the slope changes from bar to bar, the logic essentially measures market acceleration. It identifies whether a trend is gaining strength (moving faster) or losing steam (slowing down), providing a leading visual cue of potential exhaustion before a price reversal might occur.
Visual Representation
The results are displayed in a separate window, allowing you to monitor these dynamics independently of the main price chart. The indicators use color-coded lines to highlight these shifts:
- Blue Line: Represents the primary divergence between the two averages.
- Red Line: Highlights the slope, showing how the momentum is shifting over time.
In summary, this script transforms complex price movements into a simplified "momentum map," allowing you to see not just where the price is going, but how much energy and speed are currently behind that movement.
/*-----------------------------+
|			       |
| Shared by www.Aptrafx.com    |
|			       |
+------------------------------*/

//+------------------------------------------------------------------+
//|                                               iFXAnalyser_H4.mq4 |
//|                           Copyright © 2006, Renato P. dos Santos |
//|                   inspired on 4xtraderCY's and SchaunRSA's ideas |
//|   http://www.strategybuilderfx.com/forums/showthread.php?t=16086 |
//+------------------------------------------------------------------+
#property copyright "Copyright © 2006, Renato P. dos Santos"
#property link "http://www.strategybuilderfx.com/forums/showthread.php?t=16086"

#property indicator_separate_window
#property indicator_buffers 3
#property indicator_color1 Blue
#property indicator_color2 Red

//---- indicator parameters
extern int MA_Shift=0;
//---- indicator buffers
double ind_buffer0[];
double ind_buffer1[];
int FastMA=4;
int SlowMA=6;
int Fast_MAMode = PRICE_CLOSE;
int Slow_MAMode = PRICE_OPEN;

//----
int counted_bars=0;
//+------------------------------------------------------------------+
//| Custom indicator initialization function                         |
//+------------------------------------------------------------------+
int init()
  {
   int    draw_begin;
   string short_name = "iFXAnalyser_H4";
//---- drawing settings
   SetIndexStyle(0,DRAW_LINE);
   SetLevelStyle(STYLE_DOT,1,Black);
   SetLevelValue(1,15*Point);
   SetLevelValue(2,-15*Point);
   SetIndexShift(0,MA_Shift);
   IndicatorDigits(MarketInfo(Symbol(),MODE_DIGITS)+1);
   draw_begin=FastMA-1;
   SetIndexDrawBegin(0,draw_begin);
//---- indicator short name
   IndicatorShortName(short_name+"("+FastMA+","+SlowMA+")");
   SetIndexLabel(0,short_name+"Div");
   SetIndexLabel(1,short_name+"Slope");
   SetIndexLabel(2,short_name+"Accel");
//---- indicator buffers mapping
   if(!SetIndexBuffer(0,ind_buffer0) && !SetIndexBuffer(1,ind_buffer1))
     Alert("cannot set indicator buffer!");
//---- initialization done
   return(0);
  }
//+------------------------------------------------------------------+
//| Shaun's 2MA difference                                           |
//+------------------------------------------------------------------+
int start()
  {
   if(Bars<=MathMax(FastMA,SlowMA)) return(0);
   int counted_bars=IndicatorCounted();
//---- check for possible errors
   if (counted_bars<0) return(-1);
//---- last counted bar will be recounted
   if (counted_bars>0) counted_bars--;
//---- Shaun's Divergence counted in the 1-st buffer
   int limit=Bars-counted_bars;
   int i;
   for(i=0; i<limit; i++)
      ind_buffer0[i]=iMA(NULL,0,FastMA,0,MODE_SMA,Fast_MAMode,i)
                     -iMA(NULL,0,SlowMA,0,MODE_SMA,Slow_MAMode,i);
//---- Shaun's Slope counted in the 2-nd buffer
   for(i=0; i<limit-1; i++)
      ind_buffer1[i]=(iMA(NULL,0,FastMA,0,MODE_SMA,Fast_MAMode,i)
                       -iMA(NULL,0,SlowMA,0,MODE_SMA,Slow_MAMode,i))
                     -(iMA(NULL,0,FastMA,0,MODE_SMA,Fast_MAMode,i+1)
                       -iMA(NULL,0,SlowMA,0,MODE_SMA,Slow_MAMode,i+1));
//---- done
   return(0);
  }
Comments