J_TPO_v2
Download script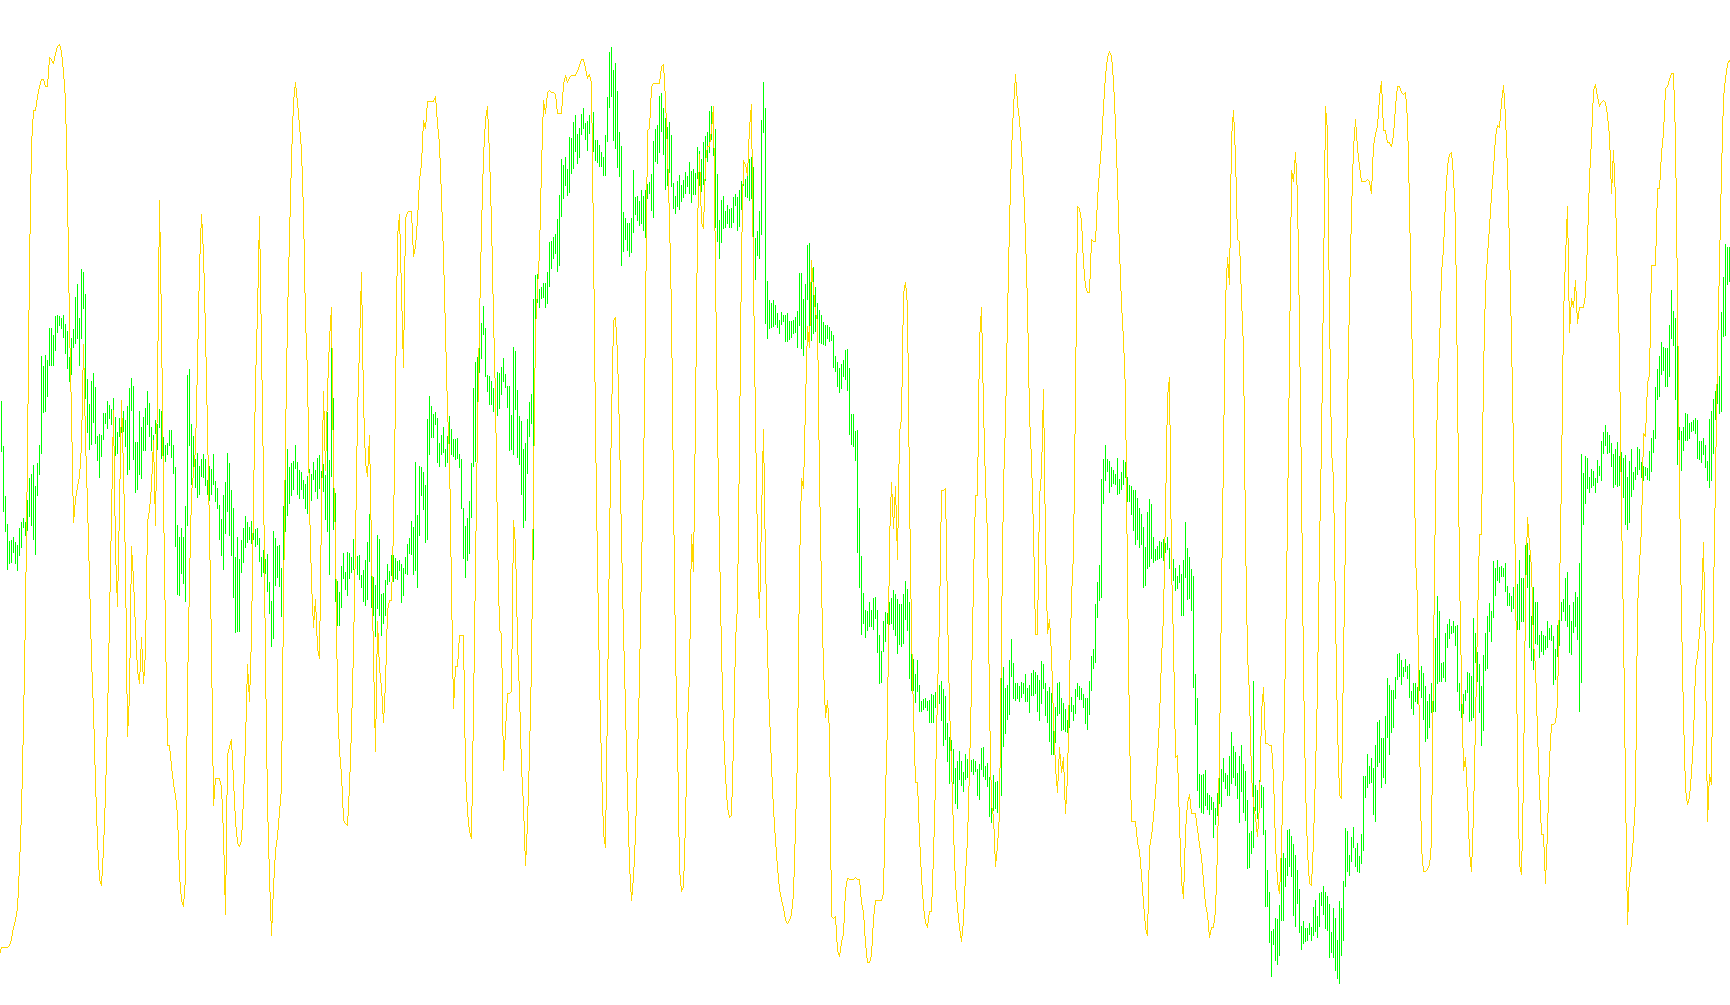
This tool is designed to analyze price movement by identifying specific patterns in historical data and calculating a smoothed representation of those trends. Rather than simply looking at the raw price, it focuses on how the price changes over a user-defined period (the "Length").
How the Logic Works
1. Data Collection and Grouping The script scans through past price points to group them into distinct segments. It looks for sequences of price changes and organizes them into an internal memory structure. This allows the tool to "remember" the order and magnitude of previous movements rather than just looking at the current price in isolation.
2. Sorting and Sequence Analysis Once a sufficient amount of data is collected for the specified period, the script performs a sorting process. It organizes these price changes to understand their relative positions. By doing this, it can differentiate between small, erratic fluctuations and significant, sustained movements.
3. Weighting and Averaging After organizing the data, the logic applies a mathematical calculation to determine the "center" of the movement. It treats the sequence of price changes as a set of coordinates. It then calculates a weighted average to find where the trend truly sits. This helps in smoothing out "noise"—those tiny, meaningless price flickers—so that only the more substantial trends remain visible.
4. Resulting Output The final result is plotted as a smooth line in a separate window at the bottom of your trading chart.
- When the line shows significant activity, it indicates a period where organized price movement has occurred.
- If there is no significant organized trend detected, the script defaults to a near-zero value, keeping the indicator clean and easy to read.
Summary for the User
In simple terms, this indicator acts as a trend filter. It gathers a window of recent prices, sorts them to see how they relate to one another, calculates the "gravity" or core trend of that movement, and draws a line representing that underlying direction. It is designed to help you see the organized structure behind price action rather than just the raw, jagged movements of the market.
/*-----------------------------+
|			       |
| Shared by www.Aptrafx.com    |
|			       |
+------------------------------*/

//+------------------------------------------------------------------+
//|                                                        J_TPO.mq4 |
//|                      Copyright © 2004,                           |
//|                                                                  |
//+------------------------------------------------------------------+
#property copyright "Copyright © 2004, ."
#property link      ""

#property indicator_separate_window
#property indicator_minimum -1
#property indicator_maximum 1
#property indicator_buffers 1
#property indicator_color1 DodgerBlue
//---- input parameters
extern int       Len=14;
//---- buffers
double ExtMapBuffer1[];
//+------------------------------------------------------------------+
//| Custom indicator initialization function                         |
//+------------------------------------------------------------------+
int init()
  {
//---- indicators
   SetIndexStyle(0,DRAW_LINE);
   SetIndexBuffer(0, ExtMapBuffer1);
//----
   return(0);
  }

//+------------------------------------------------------------------+
//| J_TPO indicatop                                                  |
//+------------------------------------------------------------------+
int start()
  {
   //int limit;
   //int counted_bars=IndicatorCounted();
//---- check for possible errors
   //if(counted_bars<0) return(-1);
//---- last counted bar will be recounted
   //if(counted_bars>0) counted_bars--;
   //limit=Bars-counted_bars;
//---- main loop

     double f0, f8, f10, f18, f20, f28, f30, f40, k,
      var14, var18, var1C, var20, var24, shift, value;
     int f38, f48, var6, var12, varA, varE;
     double arr0[300], arr1[300], arr2[300], arr3[300];

   //f38=0;
   for(int i=Bars-Len-100; i>=0; i--)
     {
     var14=0;
     var1C=0;
     if(f38==0)
      {
      f38=1;
      f40=0;
      if (Len-1>= 2) f30=Len-1;
      else f30=2;
      f48=f30+1;
      f10=Close[i];
      arr0[f38] = Close[i];
      k=f48;
      f18 = 12 / (k * (k - 1) * (k + 1));
      f20 = (f48 + 1) * 0.5;
      }
     else
      {
      if (f38 <= f48) f38 = f38 + 1;
      else f38 = f48 + 1;
      f8 = f10;
      f10 = Close[i];
      if (f38 > f48)
        {
        for (var6 = 2; var6<=f48; var6++) arr0[var6-1] = arr0[var6];
        arr0[f48] = Close[i];
        }
      else arr0[f38] = Close[i];
      if ((f30 >= f38) && (f8 != f10)) f40 = 1;
      if ((f30 == f38) && (f40 == 0)) f38 = 0;
     }

   if (f38 >= f48)
      {
      for (varA=1; varA<=f48; varA++)
         {
         arr2[varA] = varA;
         arr3[varA] = varA;
         arr1[varA] = arr0[varA];
         }

      for (varA=1; varA<=(f48-1); varA++)
         {
         var24 = arr1[varA];
         var12 = varA;
         var6 = varA + 1;
         for (var6=varA+1; var6<=f48; var6++)
            {
            if (arr1[var6] < var24)
               {
               var24 = arr1[var6];
               var12 = var6;
               }
            }

         var20 = arr1[varA];
         arr1[varA] = arr1[var12];
         arr1[var12] = var20;
         var20 = arr2[varA];
         arr2[varA] = arr2[var12];
         arr2[var12] = var20;
         }

      varA = 1;
      while (f48 > varA)
        {
        var6 = varA + 1;
        var14 = 1;
        var1C = arr3[varA];
        while (var14 != 0)
          {
          if (arr1[varA] != arr1[var6])
             {
             if ((var6 - varA) > 1)
                {
                var1C = var1C / (var6 - varA);
                varE = varA;
                for (varE=varA; varE<=(var6-1); varE++)
                   arr3[varE] = var1C;

                }
             var14 = 0;
             }
          else
             {
             var1C = var1C + arr3[var6];
             var6 = var6 + 1;
             }
          }
        varA = var6;
        }
      var1C = 0;
      for (varA=1; varA<=f48; varA++)
        var1C = var1C + (arr3[varA] - f20) * (arr2[varA] - f20);

      var18 = f18 * var1C;
     }
   else
     var18 = 0;

   value = var18;
   if (value == 0) value = 0.00001;

   ExtMapBuffer1[i]=value;
   }
//---- done
   return(0);
  }
//+------------------------------------------------------------------+
Comments