J_TPO_v4
Download script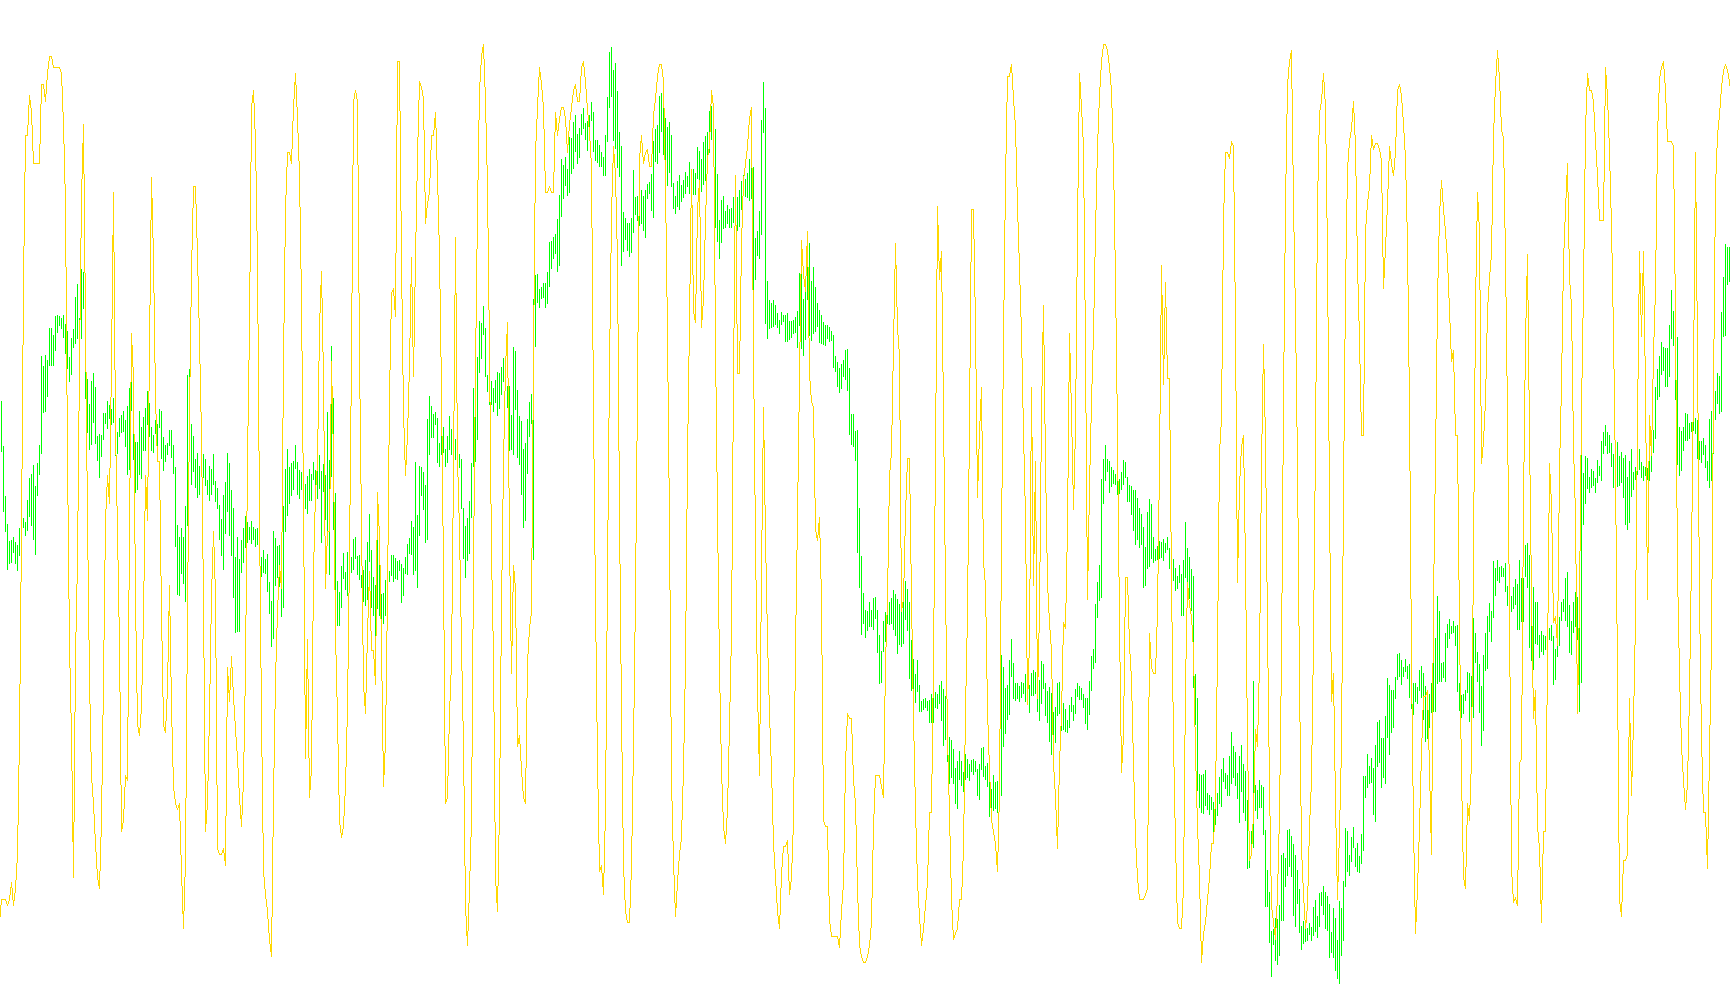
This script functions as a custom technical analysis tool designed to process historical price data and project it into a visual line on a separate window of your trading platform. Its primary objective is to analyze the relationship between price movements and their chronological progression to identify specific market behaviors.
Core Logic Overview
The logic operates by systematically scanning past price "bars" (the closing prices of candles) and organizing them into organized sequences. Instead of looking at simple price changes, the script evaluates how those prices are distributed over a specific period defined by the user's settings.
How the Process Works
- Data Collection: The script identifies a set amount of historical data points based on the "Len" (Length) parameter provided. It looks for sequences where price changes occur, effectively building a map of how the market has moved over time.
- Sequence Organization: Once it identifies a movement sequence, the logic organizes these prices into an internal list. It then performs a sorting process to arrange these values in a specific order (from lowest to highest).
- Distribution Mapping: After sorting the data, the script calculates the "position" of each price within that sorted group. It attempts to smooth out any identical consecutive prices to ensure that the distribution reflects a continuous flow rather than stagnant price points.
- Mathematical Correlation: The heart of the logic involves calculating a correlation-style value. It compares the actual chronological order of the prices against their sorted order. By calculating the variance between where a price is (in time) and where it should be (in the sorted sequence), it produces a unique numerical result.
- Normalization: The final result is scaled using a specific mathematical formula to ensure it fits within a readable range. This converts complex raw data into a single line that fluctuates as market trends shift.
Visual Output
The final output is rendered as a smooth line in a separate window. This allows traders to see the "momentum" or "structure" of price action independently of the main price chart. When the line moves upward or downward, it represents the underlying mathematical relationship between the current price trend and its historical distribution pattern.
//+------------------------------------------------------------------+
//|                                                        J_TPO.mq4 |
//|                      Copyright © 2004,                           |
//|                                                                  |
//+------------------------------------------------------------------+
#property copyright "Copyright © 2004, ."
#property link      ""
//----
#property indicator_separate_window
#property indicator_minimum -1
#property indicator_maximum 1
#property indicator_buffers 1
#property indicator_color1 DodgerBlue
//---- input parameters
extern int       Len=10;
//---- buffers
double ExtMapBuffer1[];
//+------------------------------------------------------------------+
//| Custom indicator initialization function                         |
//+------------------------------------------------------------------+
int init()
  {
//---- indicators
   SetIndexStyle(0,DRAW_LINE);
   SetIndexBuffer(0, ExtMapBuffer1);
//----
   return(0);
  }
//+------------------------------------------------------------------+
//| J_TPO indicatop                                                  |
//+------------------------------------------------------------------+
int start()
  {
   //int limit;
   //int counted_bars=IndicatorCounted();
//---- check for possible errors
   //if(counted_bars<0) return(-1);
//---- last counted bar will be recounted
   //if(counted_bars>0) counted_bars--;
   //limit=Bars-counted_bars;
//---- main loop
   double f0, f8, f10, f18, f20, f28, f30, f40, k,
   var14, var18, var1C, var20, var24, shift, value;
   int f38, f48, var6, var12, varA, varE;
   double arr0[300], arr1[300], arr2[300], arr3[300];
   //f38=0;
   for(int i=Bars-Len-100; i>=0; i--)
     {
      var14=0;
      var1C=0;
      if(f38==0)
        {
         f38=1;
         f40=0;
         if (Len-1>= 2) f30=Len-1;
         else f30=2;
         f48=f30+1;
         f10=Close[i];
         arr0[f38]=Close[i];
         k=f48;
         f18=12/(k * (k - 1) * (k + 1));
         f20=(f48 + 1) * 0.5;
        }
      else
        {
         if (f38<=f48) f38=f38 + 1;
         else f38=f48 + 1;
         f8=f10;
         f10=Close[i];
         if (f38 > f48)
           {
            for(var6=2; var6<=f48; var6++) arr0[var6-1]=arr0[var6];
            arr0[f48]=Close[i];
           }
         else arr0[f38]=Close[i];
         if ((f30>=f38) && (f8!=f10)) f40=1;
         if ((f30==f38) && (f40==0)) f38=0;
        }
      if (f38>=f48)
        {
         for(varA=1; varA<=f48; varA++)
           {
            arr2[varA]=varA;
            arr3[varA]=varA;
            arr1[varA]=arr0[varA];
           }
         for(varA=1; varA<=(f48-1); varA++)
           {
            var24=arr1[varA];
            var12=varA;
            var6=varA + 1;
            for(var6=varA+1; var6<=f48; var6++)
              {
               if (arr1[var6] < var24)
                 {
                  var24=arr1[var6];
                  var12=var6;
                 }
              }
            var20=arr1[varA];
            arr1[varA]=arr1[var12];
            arr1[var12]=var20;
            var20=arr2[varA];
            arr2[varA]=arr2[var12];
            arr2[var12]=var20;
           }
         varA=1;
         while(f48 > varA)
           {
            var6=varA + 1;
            var14=1;
            var1C=arr3[varA];
            while(var14!=0)
              {
               if (arr1[varA]!=arr1[var6])
                 {
                  if ((var6 - varA) > 1)
                    {
                     var1C=var1C/(var6 - varA);
                     varE=varA;
                     for(varE=varA; varE<=(var6-1); varE++)
                        arr3[varE]=var1C;
                    }
                  var14=0;
                 }
               else
                 {
                  var1C=var1C + arr3[var6];
                  var6=var6 + 1;
                 }
              }
            varA=var6;
           }
         var1C=0;
         for(varA=1; varA<=f48; varA++)
            var1C=var1C + (arr3[varA] - f20) * (arr2[varA] - f20);
//----
         var18=f18 * var1C;
        }
      else
         var18=0;
//----
      value=var18;
      if (value==0) value=0.00001;
//----
      ExtMapBuffer1[i]=value;
     }
//---- done
   return(0);
  }
//+------------------------------------------------------------------+
Comments