J_TPO
Download script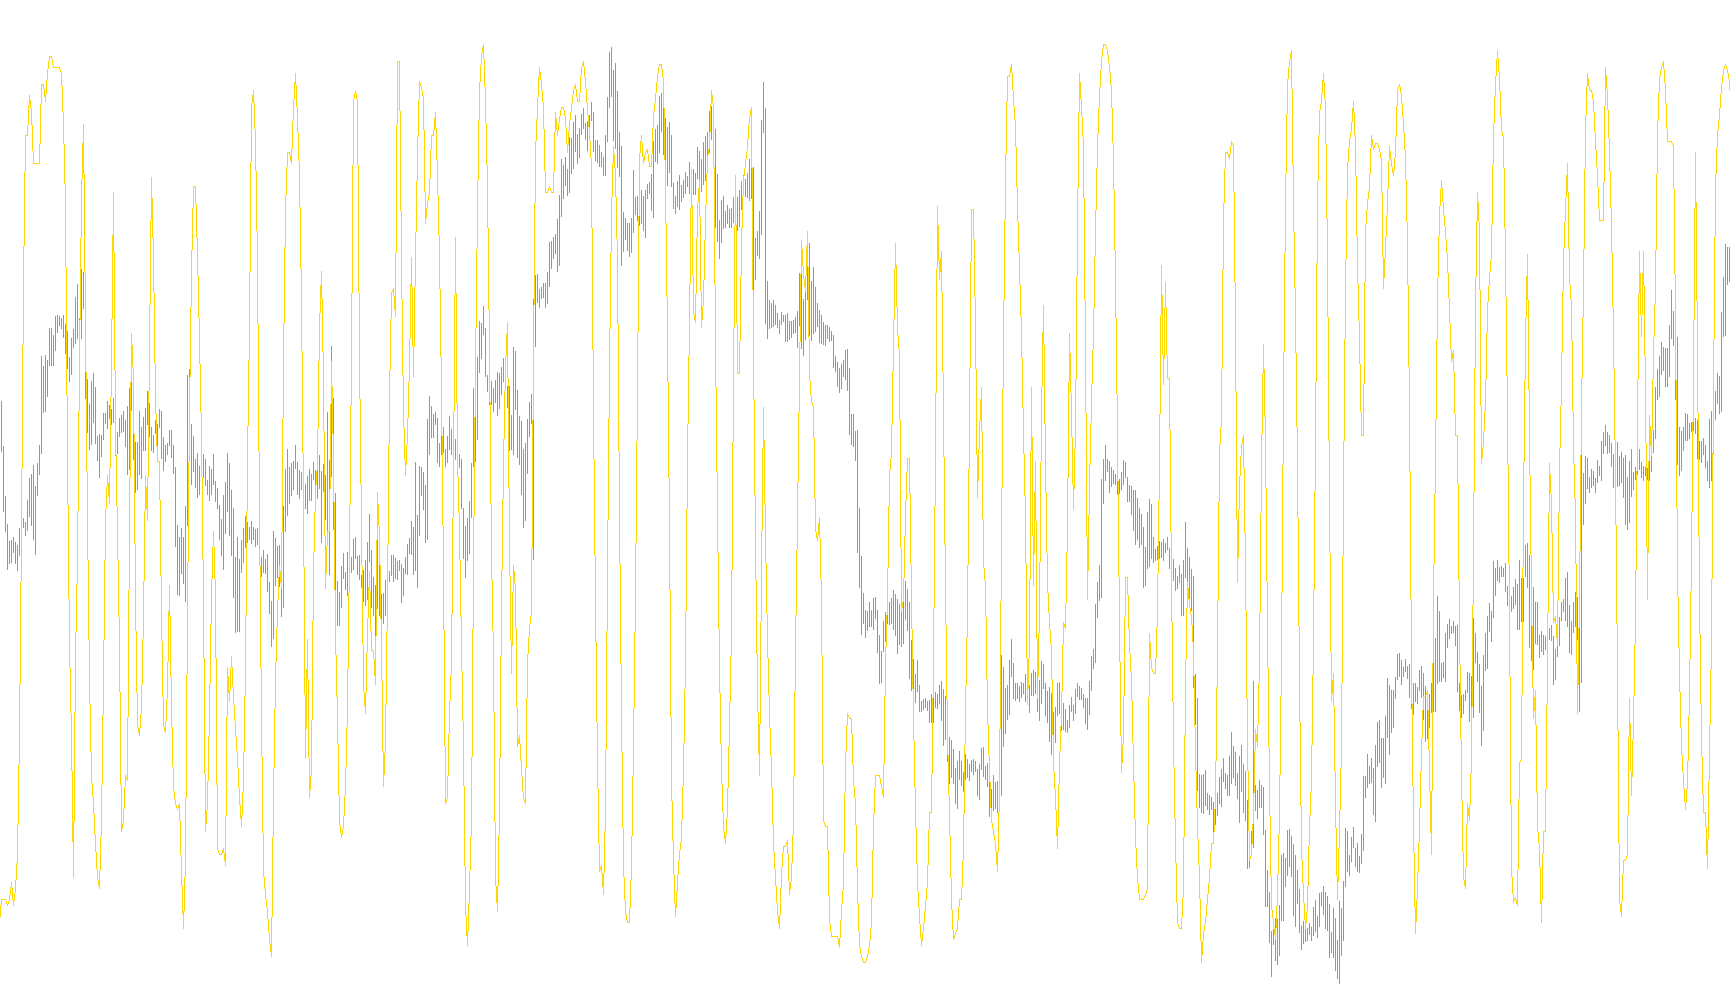
This script is a custom technical analysis indicator designed to visualize specific price movement patterns on a trading platform. Rather than simply showing the current price, it processes historical data to calculate a specialized mathematical value that helps traders understand market dynamics.
Core Logic Overview
The indicator operates by scanning through historical price bars to identify and analyze "blocks" of price action. Instead of looking at every single price tick in isolation, the logic groups consecutive price movements together based on a user-defined length (the "Len" parameter).
Key Functional Steps
1. Data Collection and Grouping The script moves backward through time to collect closing prices. It organizes these prices into dynamic arrays, effectively creating a snapshot of how the market has moved over a specific period. It identifies whether the price is staying flat, moving in one direction, or shifting significantly.
2. Pattern Recognition and Sorting Once a sufficient amount of data is gathered within its window, the script performs an internal sorting process. It arranges the identified price points to determine the relative importance of each movement. This allows the indicator to distinguish between minor "noise" and significant trends.
3. Mathematical Weighting The logic then applies a sophisticated calculation to these sorted prices. It measures the variance and distribution of the prices within the group. Specifically, it calculates:
- The distance of price movements from a central average point.
- The frequency and duration of specific price levels.
- A weighted value that takes into account the "momentum" or "density" of those price changes.
4. Output Generation Finally, the script converts these complex internal calculations into a single numerical value. This value is then plotted as a smooth line in a separate window below your main chart.
Practical Application
For the end user, this means the indicator isn't just reacting to what the price is now. It is providing a visual representation of the "underlying character" of the price movement over the last several bars. By observing the resulting line, traders can identify trends or shifts in market sentiment that might not be immediately obvious by looking at raw price candles alone.
//+------------------------------------------------------------------+
//|                                                        J_TPO.mq4 |
//|                      Copyright © 2004,                           |
//|                                                                  |
//+------------------------------------------------------------------+
#property copyright "Copyright © 2004, ."
#property link      ""

#property indicator_separate_window
#property indicator_minimum -1
#property indicator_maximum 1
#property indicator_buffers 1
#property indicator_color1 DodgerBlue
//---- input parameters
extern int       Len=10;
//---- buffers
double ExtMapBuffer1[];
//+------------------------------------------------------------------+
//| Custom indicator initialization function                         |
//+------------------------------------------------------------------+
int init()
  {
//---- indicators
   SetIndexStyle(0,DRAW_LINE);
   SetIndexBuffer(0, ExtMapBuffer1);
//----
   return(0);
  }

//+------------------------------------------------------------------+
//| J_TPO indicatop                                                  |
//+------------------------------------------------------------------+
int start()
  {
   //int limit;
   //int counted_bars=IndicatorCounted();
//---- check for possible errors
   //if(counted_bars<0) return(-1);
//---- last counted bar will be recounted
   //if(counted_bars>0) counted_bars--;
   //limit=Bars-counted_bars;
//---- main loop

     double f0, f8, f10, f18, f20, f28, f30, f40, k,
      var14, var18, var1C, var20, var24, shift, value;
     int f38, f48, var6, var12, varA, varE;
     double arr0[300], arr1[300], arr2[300], arr3[300];

   //f38=0;
   for(int i=Bars-Len-100; i>=0; i--)
     {
     var14=0;
     var1C=0;
     if(f38==0)
      {
      f38=1;
      f40=0;
      if (Len-1>= 2) f30=Len-1;
      else f30=2;
      f48=f30+1;
      f10=Close[i];
      arr0[f38] = Close[i];
      k=f48;
      f18 = 12 / (k * (k - 1) * (k + 1));
      f20 = (f48 + 1) * 0.5;
      }
     else
      {
      if (f38 <= f48) f38 = f38 + 1;
      else f38 = f48 + 1;
      f8 = f10;
      f10 = Close[i];
      if (f38 > f48)
        {
        for (var6 = 2; var6<=f48; var6++) arr0[var6-1] = arr0[var6];
        arr0[f48] = Close[i];
        }
      else arr0[f38] = Close[i];
      if ((f30 >= f38) && (f8 != f10)) f40 = 1;
      if ((f30 == f38) && (f40 == 0)) f38 = 0;
     }

   if (f38 >= f48)
      {
      for (varA=1; varA<=f48; varA++)
         {
         arr2[varA] = varA;
         arr3[varA] = varA;
         arr1[varA] = arr0[varA];
         }

      for (varA=1; varA<=(f48-1); varA++)
         {
         var24 = arr1[varA];
         var12 = varA;
         var6 = varA + 1;
         for (var6=varA+1; var6<=f48; var6++)
            {
            if (arr1[var6] < var24)
               {
               var24 = arr1[var6];
               var12 = var6;
               }
            }

         var20 = arr1[varA];
         arr1[varA] = arr1[var12];
         arr1[var12] = var20;
         var20 = arr2[varA];
         arr2[varA] = arr2[var12];
         arr2[var12] = var20;
         }

      varA = 1;
      while (f48 > varA)
        {
        var6 = varA + 1;
        var14 = 1;
        var1C = arr3[varA];
        while (var14 != 0)
          {
          if (arr1[varA] != arr1[var6])
             {
             if ((var6 - varA) > 1)
                {
                var1C = var1C / (var6 - varA);
                varE = varA;
                for (varE=varA; varE<=(var6-1); varE++)
                   arr3[varE] = var1C;

                }
             var14 = 0;
             }
          else
             {
             var1C = var1C + arr3[var6];
             var6 = var6 + 1;
             }
          }
        varA = var6;
        }
      var1C = 0;
      for (varA=1; varA<=f48; varA++)
        var1C = var1C + (arr3[varA] - f20) * (arr2[varA] - f20);

      var18 = f18 * var1C;
     }
   else
     var18 = 0;

   value = var18;
   if (value == 0) value = 0.00001;

   ExtMapBuffer1[i]=value;
   }
//---- done
   return(0);
  }
//+------------------------------------------------------------------+
Comments