MACD Hist
Download script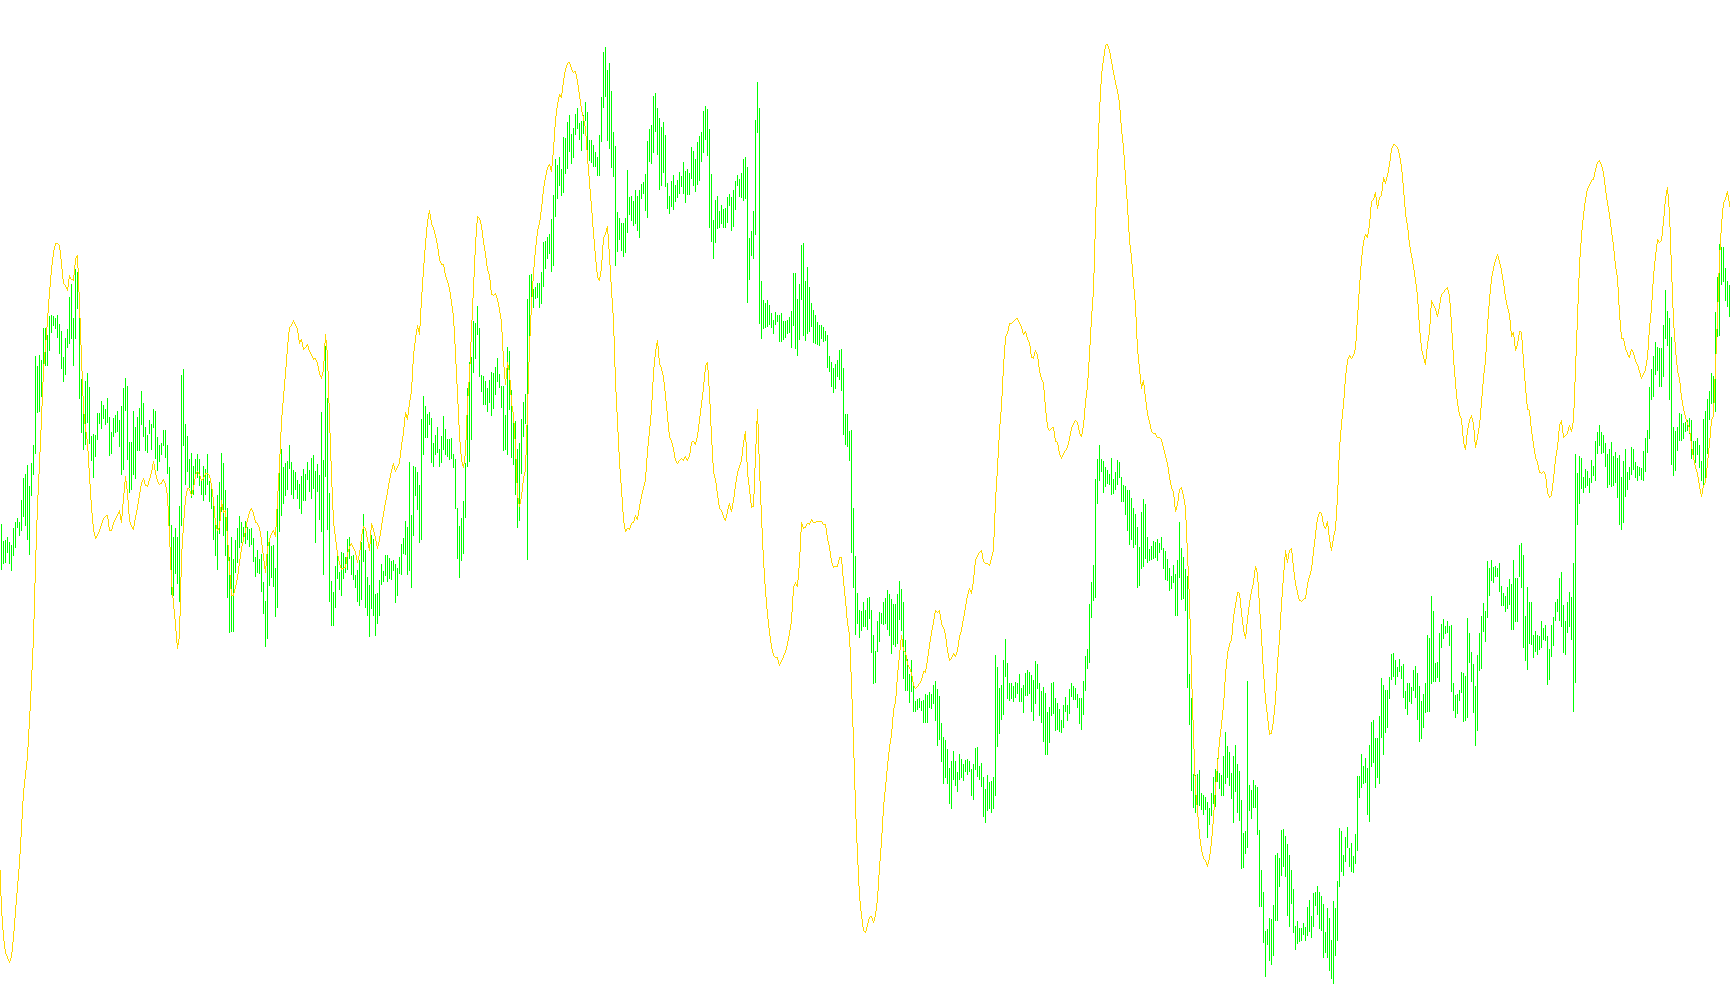
This custom technical indicator is designed to provide traders with a multi-layered view of market momentum and trend direction by combining three distinct analytical tools into a single visual display. By merging these components, the script helps in identifying the strength of a price movement and predicting potential shifts in market behavior.
Core Components and Logic
The tool operates by processing three specific types of data:
1. The MACD Line (Moving Average Convergence Divergence) At its foundation, the script calculates the difference between two different types of moving averages—a "fast" average and a "slow" average. This logic is used to determine the velocity of price changes. When the fast average moves significantly away from the slow average, it signals that momentum is increasing in one direction. Conversely, when they move closer together, it suggests the current trend is losing steam.
2. The Signal Line To help filter out "noise" and provide clearer entry or exit points, the script takes the results of the MACD calculation and applies a secondary smoothing process. This creates a "Signal Line." By comparing the main MACD line against this smoothed signal line, traders can identify specific moments where momentum is accelerating or decelerating relative to its recent history.
3. The OsMA (Oscillator of Moving Average) The third layer of logic incorporates the OsMA component. This provides a visual representation of the difference between two moving averages plotted as a histogram. While the MACD lines show the relationship between trend speeds, the OsMA helps visualize the magnitude of price movements over time. It allows for a more nuanced view of how much "volume" or weight is behind a specific trend.
Visual Presentation
The script organizes these three data points into a separate window on your trading chart to ensure they do not clutter the price action:
- Lines: Two distinct lines are drawn to represent the primary MACD momentum and its corresponding Signal line.
- Histogram: A vertical bar graph (the OsMA) provides a clear, visual "pulse" of the market's underlying strength.
Summary of Purpose
Instead of relying on just one indicator, this script synthesizes three different mathematical approaches to trend analysis. By viewing the relationship between the momentum lines and the oscillator histogram simultaneously, users can better grasp whether a market move is healthy and sustainable or if it is beginning to exhaust itself.
//+------------------------------------------------------------------+
//| Custom MACD+OsMA.mq4 |
//| Copyright © 2004, MetaQuotes Software Corp. |
//| http://www.metaquotes.net/ |
//+------------------------------------------------------------------+
#property copyright "Copyright © 2004, MetaQuotes Software Corp."
#property link "http://www.metaquotes.net/"
//---- indicator settings
#property indicator_separate_window
#property indicator_buffers 3
#property indicator_color1 Lime
#property indicator_color2 Black
#property indicator_color3 Silver
//---- indicator parameters
extern int FastEMA=12;
extern int SlowEMA=26;
extern int SignalSMA=9;
//---- indicator buffers
double ind_buffer1[];
double ind_buffer2[];
double ind_buffer3[];
//+------------------------------------------------------------------+
//| Custom indicator initialization function |
//+------------------------------------------------------------------+
int init()
{
//---- drawing settings
SetIndexStyle(0,DRAW_LINE,STYLE_SOLID,1);
SetIndexStyle(1,DRAW_LINE,STYLE_SOLID,1);
SetIndexStyle(2,DRAW_HISTOGRAM,STYLE_SOLID,1);
SetIndexDrawBegin(1,SignalSMA);
IndicatorDigits(MarketInfo(Symbol(),MODE_DIGITS)+1);
//---- indicator buffers mapping
if(!SetIndexBuffer(0,ind_buffer1) && !SetIndexBuffer(1,ind_buffer2) && !SetIndexBuffer(2,ind_buffer3))
Print("cannot set indicator buffers!");
//---- name for DataWindow and indicator subwindow label
IndicatorShortName("MACD("+FastEMA+","+SlowEMA+","+SignalSMA+")");
SetIndexLabel(0,"MACD");
SetIndexLabel(1,"Signal");
SetIndexLabel(2,"OsMA");
//---- initialization done
return(0);
}
//+------------------------------------------------------------------+
//| Moving Averages Convergence/Divergence |
//+------------------------------------------------------------------+
int start()
{
int limit;
int counted_bars=IndicatorCounted();
//---- check for possible errors
if(counted_bars<0) return(-1);
//---- last counted bar will be recounted
if(counted_bars>0) counted_bars--;
limit=Bars-counted_bars;
//---- macd counted in the 1-st buffer
for(int i=0; i<limit; i++)
ind_buffer1[i]=iMA(NULL,0,FastEMA,0,MODE_EMA,PRICE_CLOSE,i)-iMA(NULL,0,SlowEMA,0,MODE_EMA,PRICE_CLOSE,i);
//---- signal line counted in the 2-nd buffer
for(i=0; i<limit; i++)
ind_buffer2[i]=iMAOnArray(ind_buffer1,Bars,SignalSMA,0,MODE_SMA,i);
for(i=0; i<limit; i++)
ind_buffer3[i]=iOsMA(NULL,0,FastEMA,SlowEMA,SignalSMA,PRICE_CLOSE,i);
//---- done
return(0);
}
Comments