MA ribbon
Download script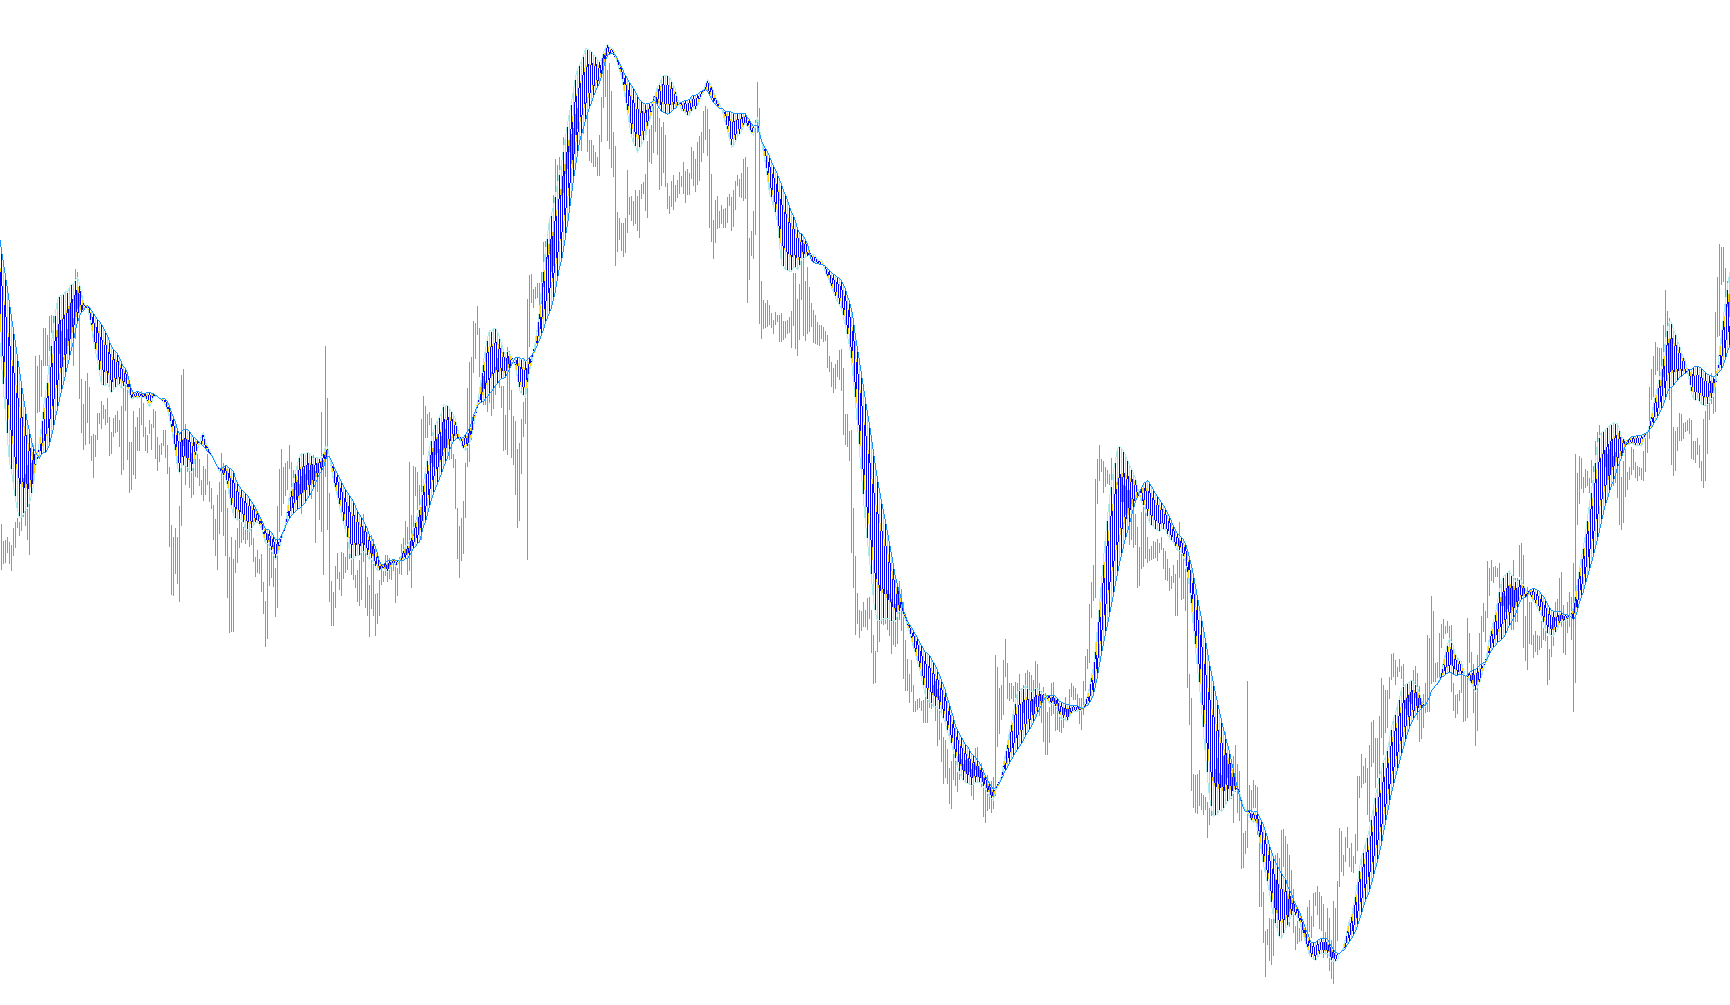
This custom indicator, known as the MA Ribbon, is designed to help traders visualize market trends and momentum by comparing two different moving averages simultaneously. Instead of just showing two independent lines on your chart, this script creates a dynamic "ribbon" effect that highlights the relationship between short-term and long-term price movements.
How the Logic Works
1. Dual Moving Average Tracking The tool starts by calculating two distinct moving averages based on parameters you can customize (such as the length of the period, the calculation method, and the specific price type).
- One moving average acts as a faster indicator, reacting more quickly to recent price changes.
- The other acts as a slower indicator, representing the broader trend of the market.
2. The "Ribbon" Dynamics The core logic of this script lies in how it displays these two averages. Rather than letting them cross over each other haphazardly, the script monitors their positions relative to one another. It uses a conditional check:
- If the data points for both averages are at the same level (a crossover point), the indicator "reassigns" which line represents which average.
- This ensures that the lines remain distinct and do not overlap in a way that obscures the visual trend.
3. Visual Representation The script is programmed to display these movements using specific colors and thicknesses:
- It provides a clear visual separation between the "fast" and "slow" data points.
- By maintaining this ribbon structure, it allows you to see the expanding or contracting space between the two averages. A widening gap often suggests increasing momentum, while a narrowing gap may signal a trend is losing steam or preparing for a reversal.
Summary for the Trader
Essentially, this script takes complex mathematical averaging and simplifies it into a visual "ribbon." It helps you identify whether the current market direction is strengthening or weakening by showing you the distance and orientation between short-term price action and long-term trends in a clean, easy-to-read format.
//+------------------------------------------------------------------+
//|                                                    MA ribbon.mq4 |
//|                                               mladenfx@gmail.com |
//|                                                                  |
//| original idea by Jose Silva                                      |
//+------------------------------------------------------------------+
#property copyright "mladen"
#property link      "mladenfx@gmail.com"

//#property indicator_chart_window
#property indicator_separate_window
#property indicator_buffers 4
#property indicator_color1 DarkSlateGray
#property indicator_color2 DarkSlateGray
#property indicator_color3 Green
#property indicator_color4 Red
#property indicator_width3 2
#property indicator_width4 2

//
//
//
//
//

extern int       MA1Period=12;
extern int       MA1Method=MODE_SMA;
extern int       MA1Price =PRICE_CLOSE;
extern int       MA2Period=27;
extern int       MA2Method=MODE_SMA;
extern int       MA2Price =PRICE_CLOSE;

//
//
//
//
//

double buffer1[];
double buffer2[];
double buffer3[];
double buffer4[];

//+------------------------------------------------------------------+
//|                                                                  |
//+------------------------------------------------------------------+
//
//
//
//
//

int init()
{
   SetIndexBuffer(0,buffer3);
   SetIndexBuffer(1,buffer4);
   SetIndexBuffer(2,buffer1);
   SetIndexBuffer(3,buffer2);
   return(0);
}
int deinit()
{
   return(0);
}

//+------------------------------------------------------------------+
//|                                                                  |
//+------------------------------------------------------------------+
//
//
//
//
//

int start()
{
   int counted_bars=IndicatorCounted();
   int limit,i;

   if(counted_bars<0) return(-1);
   if(counted_bars>0) counted_bars--;
           limit=Bars-counted_bars;

   //
   //
   //
   //
   //

   for(i=limit; i>=0; i--)
   {
      buffer1[i] = iMA(NULL,0,MA1Period,0,MA1Method,MA1Price,i);
      buffer2[i] = iMA(NULL,0,MA2Period,0,MA2Method,MA2Price,i);
      if (buffer3[i+1] == buffer1[i+1])
         {
            buffer3[i] = buffer2[i];
            buffer4[i] = buffer1[i];
         }
      else
         {
            buffer3[i] = buffer1[i];
            buffer4[i] = buffer2[i];
         }
   }
   return(0);
}
Comments