MACD+OsMA_v1
Download script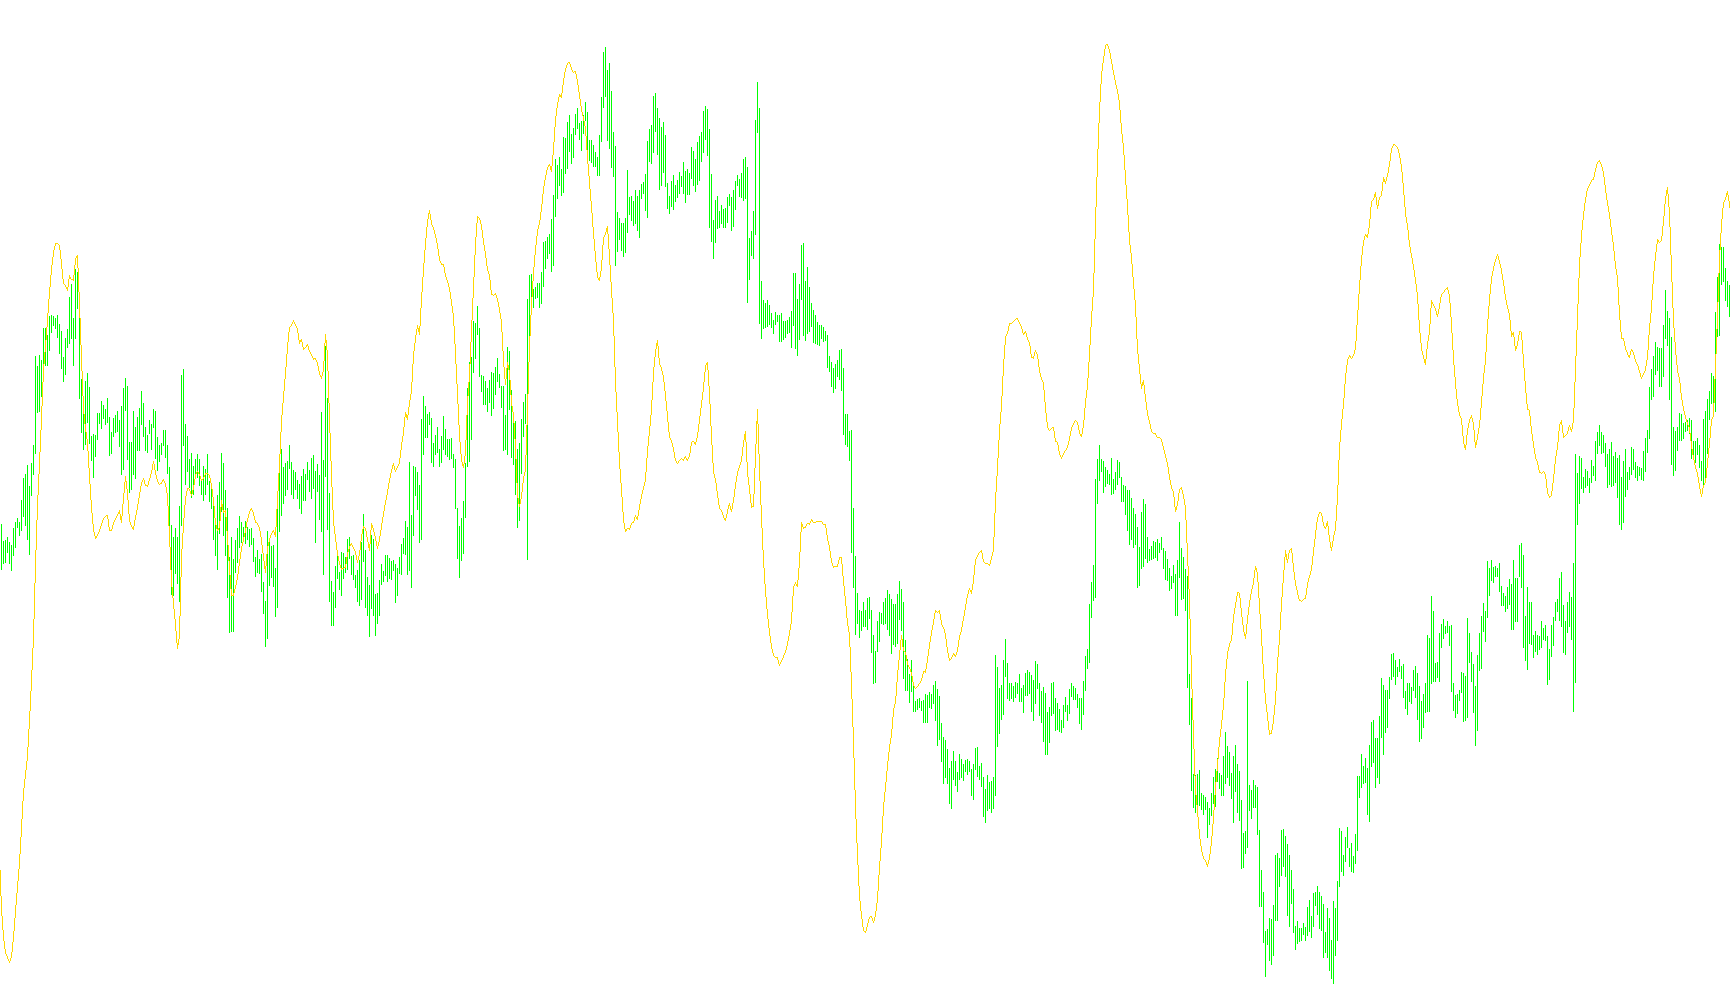
This custom trading indicator is designed to provide a comprehensive view of market momentum by combining three distinct analytical tools into a single visual display. By layering these different perspectives, the tool helps traders identify trends, potential reversals, and the overall "strength" behind price movements.
Core Components and Logic
The logic of this script functions by calculating three specific data points simultaneously:
1. The MACD Line (Trend Momentum) The script first calculates the relationship between two different moving averages—one that reacts quickly to price changes (Fast EMA) and one that follows the broader trend more smoothly (Slow EMA). By subtracting the slow average from the fast average, the indicator produces a line that shows the gap between current momentum and long-term trends. When this gap widens, it indicates strengthening momentum; when it narrows, it suggests the trend may be losing steam.
2. The Signal Line (Smoothing Filter) To prevent "false alarms" from rapid market fluctuations, the script takes the data from the MACD line described above and applies a secondary smoothing process. This creates a "Signal" line. Traders typically look at the relationship between the MACD line and this Signal line; for example, when the main line crosses over the signal line, it often serves as a visual cue that momentum is shifting in a specific direction.
3. The OsMA (Oscillator Momentum) In addition to the standard MACD calculations, the script incorporates an "On Balance" oscillator component. This calculates the cumulative momentum of price changes over time. While the first two components focus on the difference between moving averages, this third component provides a visual histogram that represents the "velocity" of the price movement. It helps traders see if the price is accelerating or decelerating at any given moment.
How it Works Together
Instead of forcing you to look at three separate charts, this script synchronizes these three calculations into one sub-window. It processes historical price data bar-by-bar to ensure that every point on the chart reflects the current state of market health. By observing how the line (MACD) interacts with the Signal line, while simultaneously monitoring the volume/velocity of the histogram (OsMA), you get a multi-layered view of whether a move is sustainable or reaching an exhaustion point.
//+------------------------------------------------------------------+
//| Custom MACD+OsMA.mq4                                             |
//| Copyright © 2004, MetaQuotes Software Corp.                      |
//| http://www.metaquotes.net/                                       |
//+------------------------------------------------------------------+
#property copyright "Copyright © 2004, MetaQuotes Software Corp."
#property link "http://www.metaquotes.net/"
//---- indicator settings
#property indicator_separate_window
#property indicator_buffers 3
#property indicator_color1 Silver
#property indicator_color2 Red
#property indicator_color3 Silver
//---- indicator parameters
extern int FastEMA=12;
extern int SlowEMA=26;
extern int SignalSMA=9;
//---- indicator buffers
double ind_buffer1[];
double ind_buffer2[];
double ind_buffer3[];
//+------------------------------------------------------------------+
//| Custom indicator initialization function                         |
//+------------------------------------------------------------------+
int init()
  {
//---- drawing settings
   SetIndexStyle(0,DRAW_LINE,STYLE_SOLID,1);
   SetIndexStyle(1,DRAW_LINE,STYLE_SOLID,1);
   SetIndexStyle(2,DRAW_HISTOGRAM,STYLE_SOLID,1);
   SetIndexDrawBegin(1,SignalSMA);
   IndicatorDigits(MarketInfo(Symbol(),MODE_DIGITS)+1);
//---- indicator buffers mapping
   if(!SetIndexBuffer(0,ind_buffer1) && !SetIndexBuffer(1,ind_buffer2) && !SetIndexBuffer(2,ind_buffer3))
      Print("cannot set indicator buffers!");
//---- name for DataWindow and indicator subwindow label
   IndicatorShortName("MACD("+FastEMA+","+SlowEMA+","+SignalSMA+")");
   SetIndexLabel(0,"MACD");
   SetIndexLabel(1,"Signal");
   SetIndexLabel(2,"OsMA");
//---- initialization done
   return(0);
  }
//+------------------------------------------------------------------+
//| Moving Averages Convergence/Divergence                           |
//+------------------------------------------------------------------+
int start()
  {
   int limit;
   int counted_bars=IndicatorCounted();
//---- check for possible errors
   if(counted_bars<0) return(-1);
//---- last counted bar will be recounted
   if(counted_bars>0) counted_bars--;
   limit=Bars-counted_bars;
//---- macd counted in the 1-st buffer
   for(int i=0; i<limit; i++)
      ind_buffer1[i]=iMA(NULL,0,FastEMA,0,MODE_EMA,PRICE_CLOSE,i)-iMA(NULL,0,SlowEMA,0,MODE_EMA,PRICE_CLOSE,i);
//---- signal line counted in the 2-nd buffer
   for(i=0; i<limit; i++)
      ind_buffer2[i]=iMAOnArray(ind_buffer1,Bars,SignalSMA,0,MODE_SMA,i);
   for(i=0; i<limit; i++)
      ind_buffer3[i]=iOsMA(NULL,0,FastEMA,SlowEMA,SignalSMA,PRICE_CLOSE,i);
//---- done
   return(0);
  }
//+------------------------------------------------------------------+
Comments