Median
Download script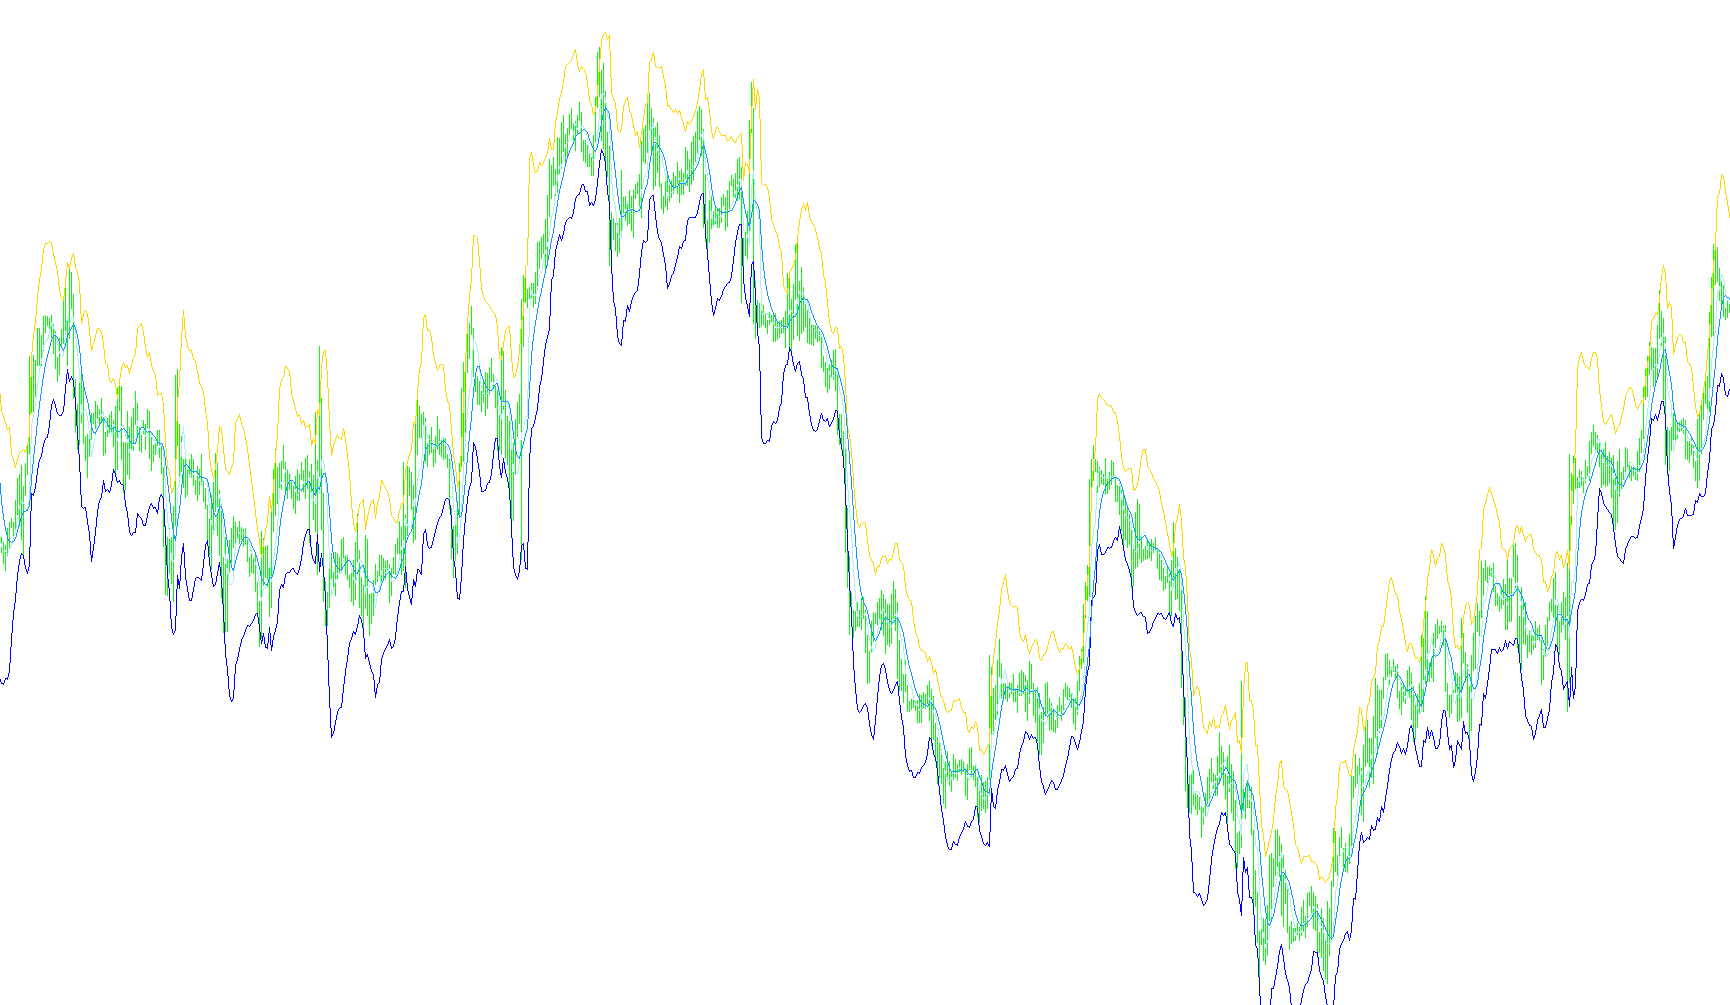
This tool is designed to provide traders with a visual map of market price action by identifying core price levels and volatility zones. Instead of just looking at a single moving average, it calculates a multi-layered "channel" that reacts to both the recent highs and lows of the market, as well as the current speed of price movement.
How the Logic Works
The script processes market data through three distinct stages to generate four unique lines on your chart:
1. Establishing the Core Range (The Median) The tool first looks at a small, recent window of price candles (defined by the "per" setting). It identifies the highest point and the lowest point reached during that timeframe. By finding the exact middle point between these two extremes, it establishes a "Median" line. This represents the fair value or the balance point of the market at that specific moment.
2. Calculating Market Volatility (The ATR Factor) To ensure the tool adapts to different market conditions—such as high-energy news spikes versus slow, quiet trading sessions—it calculates an Average True Range (ATR). This measures how much the price is "swinging" on average over a set period. The script then uses this measurement to determine how wide the price boundaries should be.
3. Creating the Dynamic Channel (Highs and Lows) Using the Median line as a base and the Volatility calculation as a multiplier, the tool draws two outer boundaries:
- The Upper Boundary: Placed above the median based on the current volatility.
- The Lower Boundary: Placed below the median based on the current volatility.
This creates a "dynamic corridor." When the market is volatile, the corridor widens; when the market is calm, the corridor narrows. This helps traders visualize the boundaries of price movement in real-time.
4. The Smoothing Signal (The Signal Line) Finally, the tool takes that Median line and applies a secondary smoothing process (an Exponential Moving Average). This creates a "Signal" line that filters out minor market noise, allowing you to see the underlying trend more clearly without being distracted by every small price flicker.
Summary of Visual Outputs
- Hi & Low: The upper and lower boundaries of the volatility corridor.
- Middle: The central balance point of the current price range.
- Signal: A smoothed version of the middle line used to identify the primary trend direction.
//+------------------------------------------------------------------+
//|                                                       Median.mq4 |
//|                      Copyright © 2004, MetaQuotes Software Corp. |
//|                                        http://www.metaquotes.net |
//+------------------------------------------------------------------+
#property copyright "Rosh"
#property link      "http://www.metaquotes.net"

#property indicator_chart_window
#property indicator_buffers 4
#property indicator_color1 Aqua
#property indicator_color2 Aqua
#property indicator_color3 Yellow
#property indicator_color4 Red

extern int per=3;
extern int Dep=300;
extern double K_ATR=2.0;
extern int Period_ATR=13;
//---- indicator buffers
double UpBuffer[];
double DownBuffer[];
double MidlleBuffer[];
double SmoothMedian[];

//----
int ExtCountedBars=0;
int LastCalcTime=0;
int LastPeriod=0;
int shift=0;
double mmin=0;
double mmax=0;
//+------------------------------------------------------------------+
//| Custom indicator initialization function                         |
//+------------------------------------------------------------------+
int init()
  {
   SetIndexStyle(0,DRAW_LINE);
   SetIndexShift(0,0);
   IndicatorDigits(MarketInfo(Symbol(),MODE_DIGITS));
   SetIndexStyle(1,DRAW_LINE);
   SetIndexShift(1,0);
   SetIndexStyle(2,DRAW_LINE);
   SetIndexShift(2,0);
   SetIndexStyle(3,DRAW_LINE);
   SetIndexShift(3,0);

   SetIndexBuffer(0,UpBuffer);
   SetIndexBuffer(1,DownBuffer);
   SetIndexBuffer(2,MidlleBuffer);
   SetIndexBuffer(3,SmoothMedian);

   SetIndexLabel(0,"Hi");
   SetIndexLabel(1,"Low");
   SetIndexLabel(2,"Midlle");
   SetIndexLabel(3,"Signal");


//---- indicators
//----
   return(0);
  }
//+------------------------------------------------------------------+
//| Custor indicator deinitialization function                       |
//+------------------------------------------------------------------+
int deinit()
  {
//---- TODO: add your code here

//----
   return(0);
  }
//+------------------------------------------------------------------+
//| Custom indicator iteration function                              |
//+------------------------------------------------------------------+
int start()
  {
   double ATR;
   int limit;
   int counter;
   int    counted_bars=IndicatorCounted();
   if(counted_bars<0) return(-1);
   //---- TODO: add your code here
   if(counted_bars>0) counted_bars--;
   limit=Bars-counted_bars;
    for (shift=limit;shift>=1;shift-- )
	  {
	  mmin=Low[Lowest(NULL,0,MODE_LOW,per,shift)];
	  mmax=High[Highest(NULL,0,MODE_HIGH,per,shift)];
	  ATR=0;
	  for (counter=Period_ATR;counter>=1;counter--)
	     {
	     ATR=ATR+MathAbs(High[shift+counter]-Low[shift+counter]);
	     }
	  ATR=ATR/Period_ATR;
     MidlleBuffer[shift-1]=(mmax+mmin)/2;
     UpBuffer[shift-1]=MidlleBuffer[shift-1]+ATR*K_ATR;
     DownBuffer[shift-1]=MidlleBuffer[shift-1]-ATR*K_ATR;
	}
   for (shift=limit;shift>=1;shift-- )
        {SmoothMedian[shift-1]=iMAOnArray(MidlleBuffer,Bars,5,0,MODE_EMA,shift-1);
	     }

//----
   //return;
  }
//+------------------------------------------------------------------+
Comments