Median_v1
Download script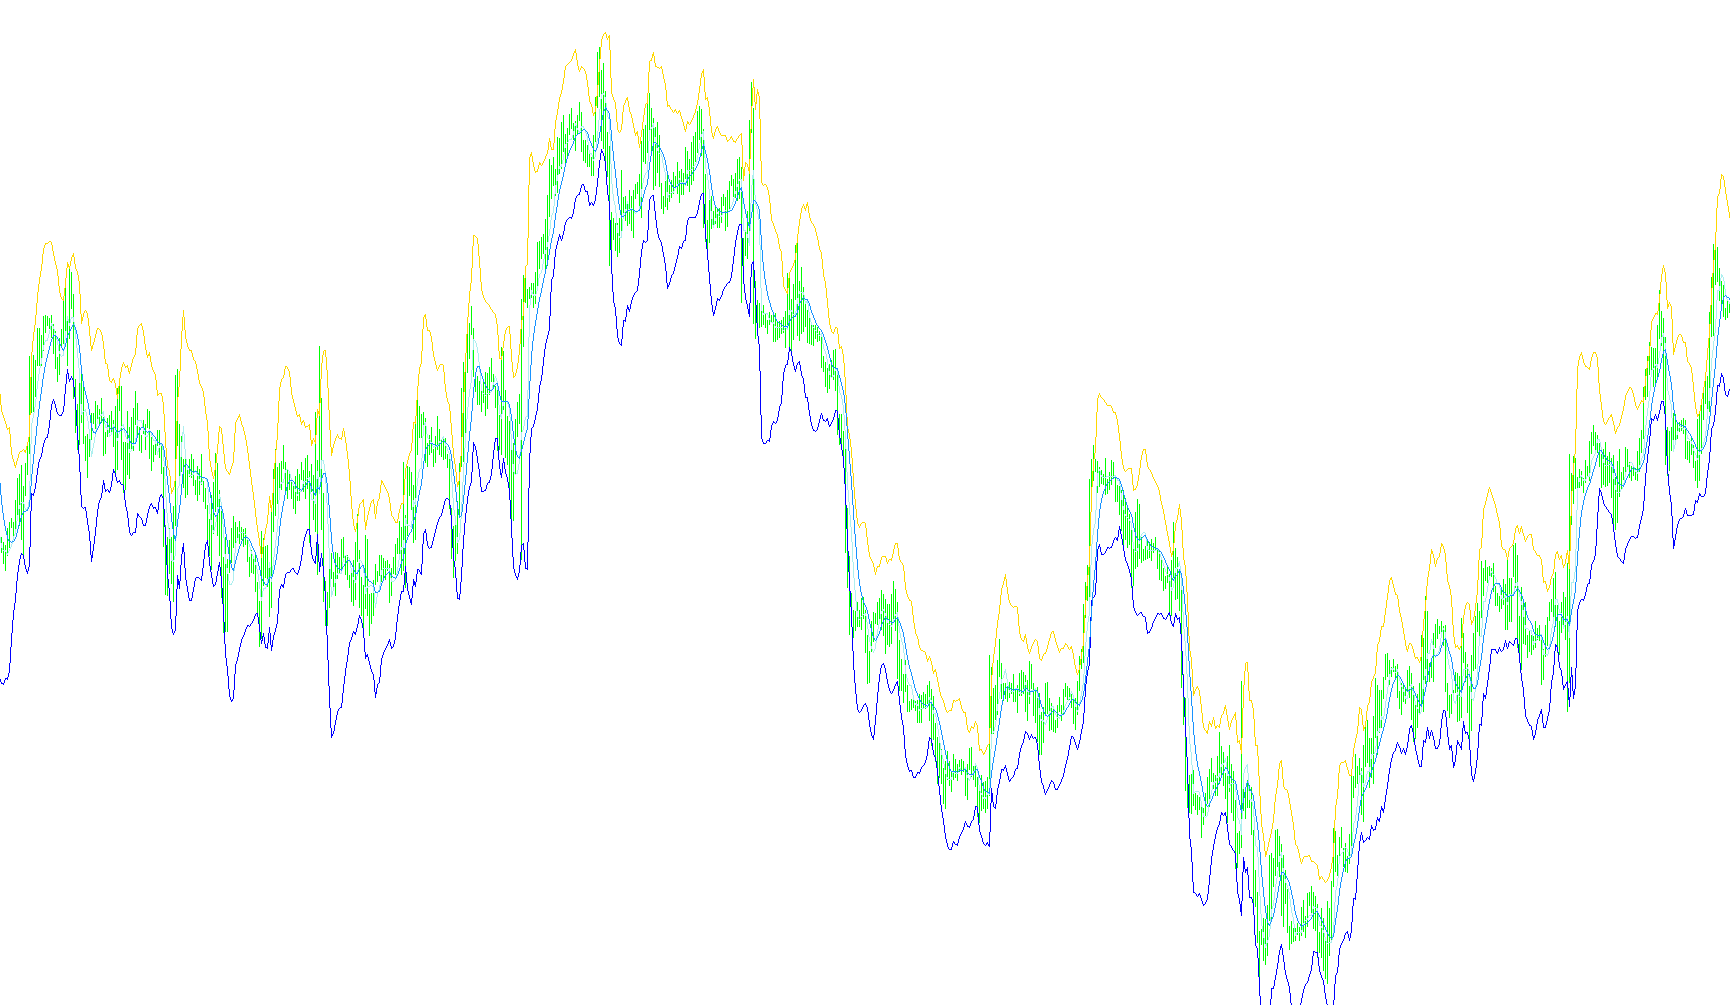
This script is designed as a visual tool for trading platforms to help identify price trends and potential volatility boundaries on a chart. It functions by calculating four distinct data points based on historical price action, creating a "channel" of information that helps traders see where the market is currently centered and how far it might swing in either direction.
How the Logic Works
1. Identifying Price Boundaries The script begins by looking at a small window of recent price history (defined by the user). It identifies two key figures:
- The lowest price reached during that period.
- The highest price reached during that period.
2. Determining the Center Point (Middle) Once the highest and lowest points are found, the script calculates the mathematical midpoint between them. This represents the "fair value" or the center of the current price action. The script then draws a line on your chart to represent this middle ground.
3. Measuring Market Volatility To understand how much the price is currently swinging, the script looks at the "Average True Range." In simple terms, it measures the distance between the highs and lows over a specific timeframe and calculates an average. This helps the script understand if the market is moving calmly or experiencing violent swings.
4. Creating the Upper and Lower Channels Using the center point and the volatility measurement calculated above, the script projects two outer boundaries:
- The Upper Bound: The center point plus a multiplier of the volatility.
- The Lower Bound: The center point minus a multiplier of the volatility.
These three lines (Upper, Middle, and Lower) create a dynamic "corridor" that expands when the market is volatile and narrows when the market is stable.
5. The Smoothing Signal Finally, the script adds an extra layer of refinement. It takes the "Middle" value and applies a smoothing formula to it. This creates a final signal line that filters out minor "noise," making it easier for the user to see the overall direction of the trend without being distracted by every tiny price flicker.
Summary of Visual Output
When you apply this script, you will see:
- A Center Line: Representing the core equilibrium of the price.
- An Upper and Lower Boundary: Defining the "active zone" of the market.
- A Signal Line: A smoothed version of the center line used to confirm long-term direction.
//+------------------------------------------------------------------+
//|                                                       Median.mq4 |
//|                      Copyright © 2004, MetaQuotes Software Corp. |
//|                                        http://www.metaquotes.net |
//+------------------------------------------------------------------+
#property copyright "Rosh"
#property link      "http://www.metaquotes.net"
//----
#property indicator_chart_window
#property indicator_buffers 4
#property indicator_color1 Aqua
#property indicator_color2 Aqua
#property indicator_color3 Yellow
#property indicator_color4 Red
//----
extern int per=3;
extern int Dep=300;
extern double K_ATR=2.0;
extern int Period_ATR=13;
//---- indicator buffers
double UpBuffer[];
double DownBuffer[];
double MidlleBuffer[];
double SmoothMedian[];
//----
int ExtCountedBars=0;
int LastCalcTime=0;
int LastPeriod=0;
int shift=0;
double mmin=0;
double mmax=0;
//+------------------------------------------------------------------+
//| Custom indicator initialization function                         |
//+------------------------------------------------------------------+
int init()
  {
   SetIndexStyle(0,DRAW_LINE);
   SetIndexShift(0,0);
   IndicatorDigits(MarketInfo(Symbol(),MODE_DIGITS));
   SetIndexStyle(1,DRAW_LINE);
   SetIndexShift(1,0);
   SetIndexStyle(2,DRAW_LINE);
   SetIndexShift(2,0);
   SetIndexStyle(3,DRAW_LINE);
   SetIndexShift(3,0);
//----
   SetIndexBuffer(0,UpBuffer);
   SetIndexBuffer(1,DownBuffer);
   SetIndexBuffer(2,MidlleBuffer);
   SetIndexBuffer(3,SmoothMedian);
//----
   SetIndexLabel(0,"Hi");
   SetIndexLabel(1,"Low");
   SetIndexLabel(2,"Midlle");
   SetIndexLabel(3,"Signal");
//---- indicators
   return(0);
  }
//+------------------------------------------------------------------+
//| Custor indicator deinitialization function                       |
//+------------------------------------------------------------------+
int deinit()
  {
//---- TODO: add your code here
//----
   return(0);
  }
//+------------------------------------------------------------------+
//| Custom indicator iteration function                              |
//+------------------------------------------------------------------+
int start()
  {
   double ATR;
   int limit;
   int counter;
   int    counted_bars=IndicatorCounted();
   if(counted_bars<0) return(-1);
//---- TODO: add your code here
   if(counted_bars>0) counted_bars--;
   limit=Bars-counted_bars;
   for(shift=limit;shift>=1;shift-- )
     {
      mmin=Low[Lowest(NULL,0,MODE_LOW,per,shift)];
      mmax=High[Highest(NULL,0,MODE_HIGH,per,shift)];
      ATR=0;
      for(counter=Period_ATR;counter>=1;counter--)
        {
         ATR=ATR+MathAbs(High[shift+counter]-Low[shift+counter]);
        }
      ATR=ATR/Period_ATR;
      MidlleBuffer[shift-1]=(mmax+mmin)/2;
      UpBuffer[shift-1]=MidlleBuffer[shift-1]+ATR*K_ATR;
      DownBuffer[shift-1]=MidlleBuffer[shift-1]-ATR*K_ATR;
     }
   for(shift=limit;shift>=1;shift-- )
     {SmoothMedian[shift-1]=iMAOnArray(MidlleBuffer,Bars,5,0,MODE_EMA,shift-1);
     }
//----
   //return;
  }
//+------------------------------------------------------------------+
Comments