METRO_v1
Download script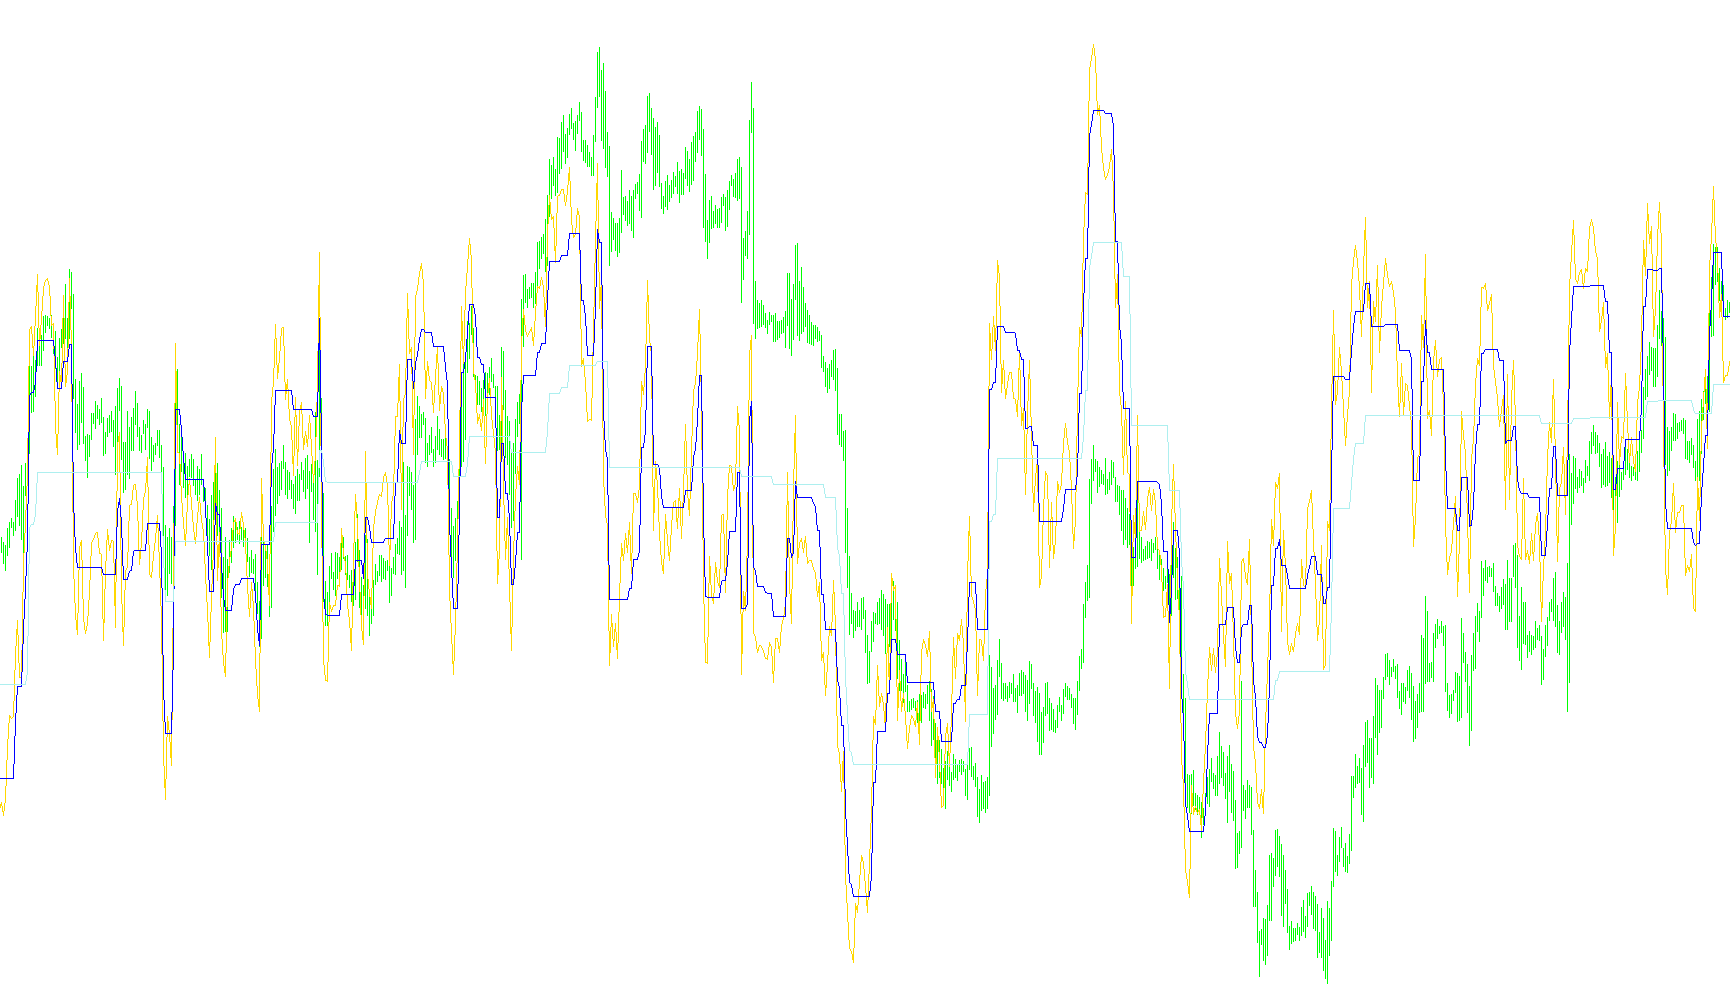
The StepRSI_v2 tool is a specialized technical indicator designed to help traders visualize market momentum and identify potential trend reversals more clearly than a standard Relative Strength Index (RSI) alone. By adding "step" logic to the traditional RSI, it creates a dynamic visual framework that highlights when price movements are becoming overextended or beginning to shift direction.
How It Works
The indicator operates by analyzing the RSI—a common measure of whether an asset is "overbought" or "oversold"—and layering two different types of "tracking envelopes" over it.
- The Core RSI: At its base, the script plots a standard RSI line. This represents the immediate strength of the current price movement.
- Dual-Speed Envelopes (Fast and Slow): The logic creates two separate tracking systems:
- The Fast Step: This reacts more quickly to price changes. It sets boundaries around the RSI to detect short-term momentum shifts.
- The Slow Step: This is more stable and reacts more gradually, helping the trader see the broader, long-term trend without being distracted by minor price fluctuations.
The "Step" Logic
Unlike a simple moving average that follows every tiny wiggle of the price, this script uses a "step" mechanism.
- Trend Identification: The logic constantly checks if the current RSI has broken outside of its previous boundaries. If the RSI moves above the upper boundary, it registers an upward trend; if it drops below the lower boundary, it registers a downward trend.
- Boundary Persistence: Once a trend is identified, the indicator "locks" or carries over the previous boundaries until the RSI makes a significant enough move to break them again. This prevents the lines from constantly oscillating and helps keep the visual signal steady.
Visual Interpretation for Traders
On your chart, you will see three distinct lines:
- The Standard RSI line shows the current heartbeat of the market.
- The Fast Step line provides a visual "buffer" that highlights immediate momentum. When the RSI interacts with this line, it suggests short-term activity.
- The Slow Step line provides a much wider "safety zone." It helps you stay on the right side of the major trend, only signaling a significant change when the market shows a sustained shift in direction.
By comparing where the RSI sits relative to these two different step boundaries, you can better distinguish between temporary "noise" in the market and genuine shifts in price momentum.
//+------------------------------------------------------------------+
//|                                                   StepRSI_v2.mq4 |
//|                           Copyright © 2005, TrendLaboratory Ltd. |
//|                                       E-mail: igorad2004@list.ru |
//+------------------------------------------------------------------+
#property copyright "Copyright © 2005, TrendLaboratory Ltd."
#property link      "E-mail: igorad2004@list.ru"

#property indicator_separate_window
#property indicator_minimum 20
#property indicator_maximum 80
#property indicator_buffers 3
#property indicator_color1 Orange
#property indicator_color2 SkyBlue
#property indicator_color3 Magenta
//---- input parameters
extern int PeriodRSI=14;
extern int StepSizeFast=5;
extern int StepSizeSlow=15;
//extern int HighLow=0;
//---- indicator buffers
double Line1Buffer[];
double Line2Buffer[];
double Line3Buffer[];
//+------------------------------------------------------------------+
//| Custom indicator initialization function                         |
//+------------------------------------------------------------------+
  int init()
  {
   string short_name;
//---- indicator line
   SetIndexStyle(0,DRAW_LINE,STYLE_SOLID,1);
   SetIndexStyle(1,DRAW_LINE,STYLE_SOLID,1);
   SetIndexStyle(2,DRAW_LINE,STYLE_SOLID,1);
   SetIndexBuffer(0,Line1Buffer);
   SetIndexBuffer(1,Line2Buffer);
   SetIndexBuffer(2,Line3Buffer);
   IndicatorDigits(MarketInfo(Symbol(),MODE_DIGITS));
//---- name for DataWindow and indicator subwindow label
   short_name="METRO("+PeriodRSI+","+StepSizeFast+","+StepSizeSlow+")";
   IndicatorShortName(short_name);
   SetIndexLabel(0,"RSI");
   SetIndexLabel(1,"StepRSI fast");
   SetIndexLabel(2,"StepRSI slow");
//----
   SetIndexDrawBegin(0,1);
   SetIndexDrawBegin(1,1);
   SetIndexDrawBegin(2,1);
//----
   return(0);
  }

//+------------------------------------------------------------------+
//| StepRSI_v2                                                         |
//+------------------------------------------------------------------+
int start()
  {
   int shift,ftrend,strend;
   double fmin0,fmax0,fmin1,fmax1,smin0,smax0,smin1,smax1,RSI0;


   for(shift=Bars-1;shift>=0;shift--)
   {
   RSI0=iRSI(NULL,0,PeriodRSI,PRICE_CLOSE,shift);

	  fmax0=RSI0+2*StepSizeFast;
	  fmin0=RSI0-2*StepSizeFast;

	  if (RSI0>fmax1)  ftrend=1;
	  if (RSI0<fmin1)  ftrend=-1;

	  if(ftrend>0 && fmin0<fmin1) fmin0=fmin1;
	  if(ftrend<0 && fmax0>fmax1) fmax0=fmax1;

	  smax0=RSI0+2*StepSizeSlow;
	  smin0=RSI0-2*StepSizeSlow;

	  if (RSI0>smax1)  strend=1;
	  if (RSI0<smin1)  strend=-1;

	  if(strend>0 && smin0<smin1) smin0=smin1;
	  if(strend<0 && smax0>smax1) smax0=smax1;


	  Line1Buffer[shift]=RSI0;

	  if (ftrend>0) Line2Buffer[shift]=fmin0+StepSizeFast;
	  if (ftrend<0) Line2Buffer[shift]=fmax0-StepSizeFast;

	  if (strend>0) Line3Buffer[shift]=smin0+StepSizeSlow;
	  if (strend<0) Line3Buffer[shift]=smax0-StepSizeSlow;

	  fmin1=fmin0;
	  fmax1=fmax0;
	  smin1=smin0;
	  smax1=smax0;
	 }
	return(0);
 }
Comments