METRO_v2
Download script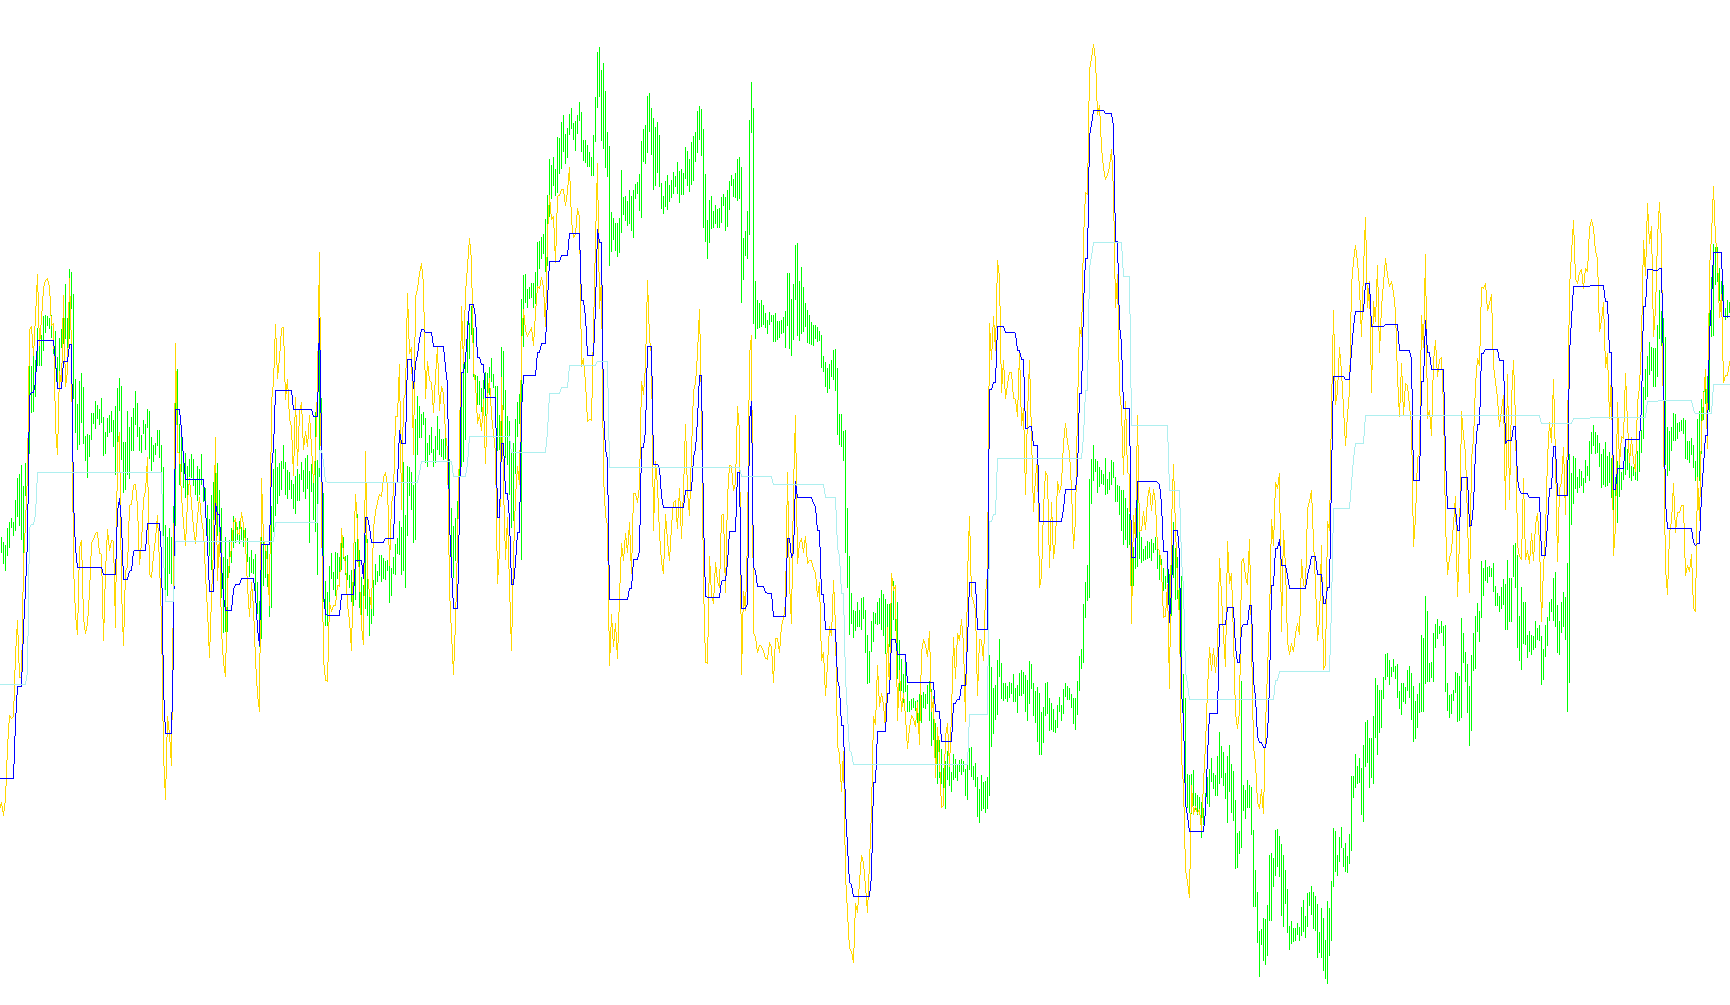
The StepRSI_v2 tool is a sophisticated visual aid designed to help traders understand momentum and trend direction by building upon the standard Relative Strength Index (RSI). While a typical RSI simply shows the speed and change of price movements, this script adds a "stepping" logic that helps filter out market noise and identify sustained directional shifts.
How the Logic Works
The indicator operates by tracking three distinct components simultaneously on your chart:
1. The Core Momentum (RSI) At its base, the script calculates a standard RSI value. This represents the fundamental "pulse" of the market. It tells you how much strength there is in the current move relative to a set timeframe.
2. The Fast Trend Tracker The script introduces a "Fast Step" logic. It creates a dynamic corridor around the RSI. If the RSI moves outside of this corridor with enough momentum, the tool "locks in" a trend direction (Up or Down).
- When it detects a strong upward move, it calculates a lower boundary line.
- When it detects a strong downward move, it calculates an upper boundary line.
- This creates a trailing effect where the line follows the price action but only adjusts when new momentum confirms a continuation of that trend.
3. The Slow Trend Tracker Simultaneously, the script performs the exact same logic but on a much larger scale (the "Slow Step"). By using a wider range, this layer ignores minor fluctuations and only reacts to significant, heavy shifts in market sentiment. It provides a "big picture" view of where the trend is heading over a longer period.
What This Means for the Trader
Instead of looking at a single line that bounces up and down, you are looking at a multi-layered system:
- Trend Confirmation: By comparing the Fast and Slow lines, you can see if the short-term momentum is aligning with the long-term trend.
- Visual Boundaries: The colored lines act as dynamic zones. They show you how far the current momentum has stretched and where the "support" or "resistance" levels are within that momentum swing.
- Noise Reduction: Because the lines require specific "steps" to move, they won't flicker or change direction every time there is a tiny price wiggle. They only shift when the market demonstrates enough conviction to break out of its previous movement profile.
In essence, this script transforms a simple momentum oscillator into a sophisticated trend-tracking system that visualizes both immediate energy and long-term direction.
//+------------------------------------------------------------------+
//|                                                   StepRSI_v2.mq4 |
//|                           Copyright © 2005, TrendLaboratory Ltd. |
//|                                       E-mail: igorad2004@list.ru |
//+------------------------------------------------------------------+
#property copyright "Copyright © 2005, TrendLaboratory Ltd."
#property link      "E-mail: igorad2004@list.ru"

#property indicator_separate_window
#property indicator_minimum 20
#property indicator_maximum 80
#property indicator_buffers 3
#property indicator_color1 Orange
#property indicator_color2 SkyBlue
#property indicator_color3 Magenta
//---- input parameters
extern int PeriodRSI=14;
extern int StepSizeFast=5;
extern int StepSizeSlow=15;
//extern int HighLow=0;
//---- indicator buffers
double Line1Buffer[];
double Line2Buffer[];
double Line3Buffer[];
//+------------------------------------------------------------------+
//| Custom indicator initialization function                         |
//+------------------------------------------------------------------+
  int init()
  {
   string short_name;
//---- indicator line
   SetIndexStyle(0,DRAW_LINE,STYLE_SOLID,1);
   SetIndexStyle(1,DRAW_LINE,STYLE_SOLID,1);
   SetIndexStyle(2,DRAW_LINE,STYLE_SOLID,1);
   SetIndexBuffer(0,Line1Buffer);
   SetIndexBuffer(1,Line2Buffer);
   SetIndexBuffer(2,Line3Buffer);
   IndicatorDigits(MarketInfo(Symbol(),MODE_DIGITS));
//---- name for DataWindow and indicator subwindow label
   short_name="METRO("+PeriodRSI+","+StepSizeFast+","+StepSizeSlow+")";
   IndicatorShortName(short_name);
   SetIndexLabel(0,"RSI");
   SetIndexLabel(1,"StepRSI fast");
   SetIndexLabel(2,"StepRSI slow");
//----
   SetIndexDrawBegin(0,1);
   SetIndexDrawBegin(1,1);
   SetIndexDrawBegin(2,1);
//----
   return(0);
  }

//+------------------------------------------------------------------+
//| StepRSI_v2                                                         |
//+------------------------------------------------------------------+
int start()
  {
   int shift,ftrend,strend;
   double fmin0,fmax0,fmin1,fmax1,smin0,smax0,smin1,smax1,RSI0;

   for(shift=Bars-1;shift>=0;shift--)
     {
      RSI0=iRSI(NULL,0,PeriodRSI,PRICE_CLOSE,shift);

      fmax0=RSI0+2*StepSizeFast;
      fmin0=RSI0-2*StepSizeFast;

      if (RSI0>fmax1)  ftrend=1;
      if (RSI0<fmin1)  ftrend=-1;
      if(ftrend>0 && fmin0<fmin1) fmin0=fmin1;
      if(ftrend<0 && fmax0>fmax1) fmax0=fmax1;

      smax0=RSI0+2*StepSizeSlow;
      smin0=RSI0-2*StepSizeSlow;

      if (RSI0>smax1)  strend=1;
      if (RSI0<smin1)  strend=-1;
      if(strend>0 && smin0<smin1) smin0=smin1;
      if(strend<0 && smax0>smax1) smax0=smax1;

      Line1Buffer[shift]=RSI0;

      if (ftrend>0) Line2Buffer[shift]=fmin0+StepSizeFast;
      if (ftrend<0) Line2Buffer[shift]=fmax0-StepSizeFast;
      if (strend>0) Line3Buffer[shift]=smin0+StepSizeSlow;
      if (strend<0) Line3Buffer[shift]=smax0-StepSizeSlow;

      fmin1=fmin0;
      fmax1=fmax0;
      smin1=smin0;
      smax1=smax0;
     }
   return(0);
  }

//+------------------------------------------------------------------+
Comments