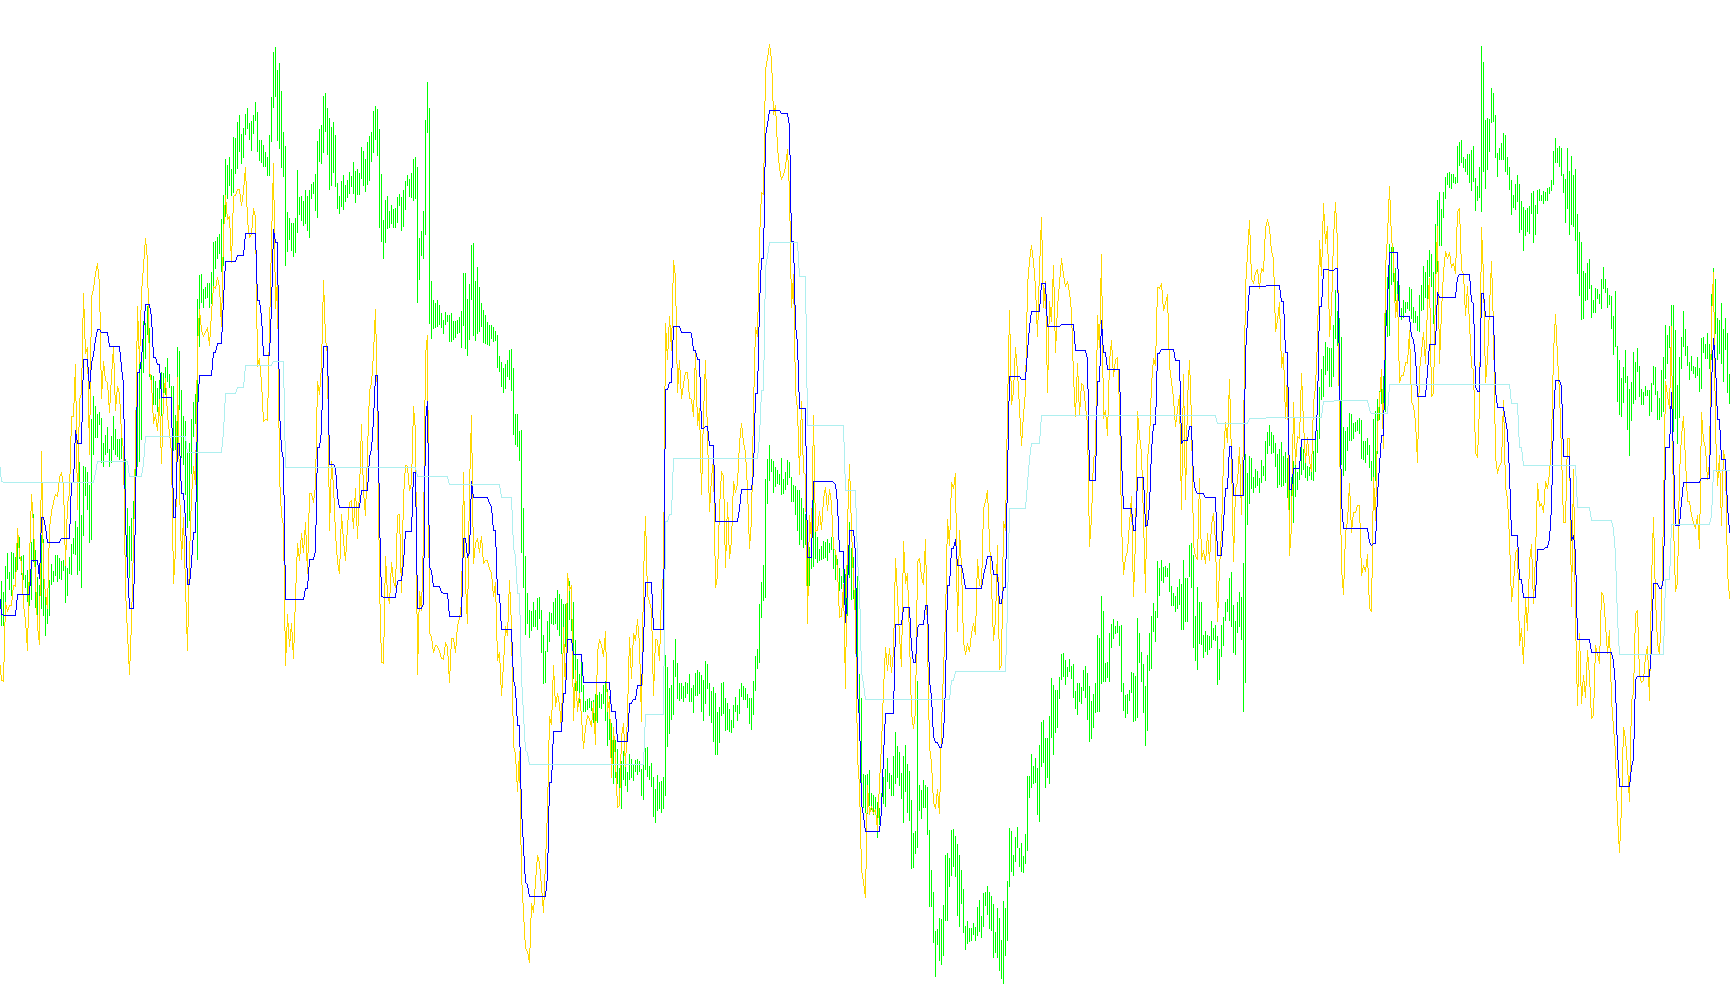
The StepRSI_v2 is a technical analysis tool designed to provide traders with a clearer picture of market momentum by filtering out the "noise" often found in standard Relative Strength Index (RSI) oscillators. While a standard RSI can fluctuate rapidly, this script introduces dynamic boundaries that help identify sustained trends and potential exhaustion points.
Core Functionality
The indicator works by calculating three distinct visual components simultaneously:
- The Base RSI: This is the foundation of the tool, representing the standard momentum of the market based on a set period (defaulting to 14).
- Fast Trend Boundaries: A secondary calculation that reacts more quickly to price changes. It creates a "step" effect, moving in larger jumps to capture shorter-term shifts in momentum.
- Slow Trend Boundaries: A third calculation designed for higher stability. This moves more deliberately, capturing the broader, long-term direction of the market and helping to filter out minor price spikes.
How the Logic Works
The script processes market data to determine the "trend direction" for both the Fast and Slow settings. Instead of simply following the current price line, it creates a logical "buffer" or range:
- Trend Detection: The tool constantly checks if the RSI has broken above or below specific thresholds defined by the "Step Sizes."
- Dynamic Locking: Once a trend is established (upward or downward), the indicator "locks" into that direction. It creates a stepped boundary that only shifts when the price momentum moves significantly enough to overcome the previous step.
- Visual Representation: On your chart, this results in three lines:
- The Orange line shows the raw RSI movement.
- The SkyBlue and Magenta lines represent the "Step" boundaries.
Practical Application for Traders
By observing where the RSI sits in relation to these Step lines, users can better identify market structure:
- Momentum Strength: When the RSI stays consistently above or below its respective Step boundaries, it indicates a strong, trending move.
- Trend Exhaustion: If the RSI approaches the edges of these steps but fails to break through them, it may suggest that the current momentum is losing steam.
- Stability: Because there are both "Fast" and "Slow" steps, traders can view the market on two different timeframes simultaneously—one for immediate reactions and one for overarching trend stability.
/*-----------------------------+
|			       |
| Shared by www.Aptrafx.com    |
|			       |
+------------------------------*/

//+------------------------------------------------------------------+
//|                                                   StepRSI_v2.mq4 |
//+------------------------------------------------------------------+

#property indicator_separate_window
#property indicator_minimum 20
#property indicator_maximum 80
#property indicator_buffers 3
#property indicator_color1 Orange
#property indicator_color2 SkyBlue
#property indicator_color3 Magenta
//---- input parameters
extern int PeriodRSI=14;
extern int StepSizeFast=5;
extern int StepSizeSlow=15;
//extern int HighLow=0;
//---- indicator buffers
double Line1Buffer[];
double Line2Buffer[];
double Line3Buffer[];
//+------------------------------------------------------------------+
//| Custom indicator initialization function                         |
//+------------------------------------------------------------------+
  int init()
  {
   string short_name;
//---- indicator line
   SetIndexStyle(0,DRAW_LINE,STYLE_SOLID,1);
   SetIndexStyle(1,DRAW_LINE,STYLE_SOLID,1);
   SetIndexStyle(2,DRAW_LINE,STYLE_SOLID,1);
   SetIndexBuffer(0,Line1Buffer);
   SetIndexBuffer(1,Line2Buffer);
   SetIndexBuffer(2,Line3Buffer);
   IndicatorDigits(MarketInfo(Symbol(),MODE_DIGITS));
//---- name for DataWindow and indicator subwindow label
   short_name="StepRSI("+PeriodRSI+","+StepSizeFast+","+StepSizeSlow+")";
   IndicatorShortName(short_name);
   SetIndexLabel(0,"RSI");
   SetIndexLabel(1,"StepRSI fast");
   SetIndexLabel(2,"StepRSI slow");
//----
   SetIndexDrawBegin(0,1);
   SetIndexDrawBegin(1,1);
   SetIndexDrawBegin(2,1);
//----
   return(0);
  }

//+------------------------------------------------------------------+
//| StepRSI_v2                                                         |
//+------------------------------------------------------------------+
int start()
  {
   int shift,ftrend,strend;
   double fmin0,fmax0,fmin1,fmax1,smin0,smax0,smin1,smax1,RSI0;


   for(shift=Bars-1;shift>=0;shift--)
   {
   RSI0=iRSI(NULL,0,PeriodRSI,PRICE_CLOSE,shift);

	  fmax0=RSI0+2*StepSizeFast;
	  fmin0=RSI0-2*StepSizeFast;

	  if (RSI0>fmax1)  ftrend=1;
	  if (RSI0<fmin1)  ftrend=-1;

	  if(ftrend>0 && fmin0<fmin1) fmin0=fmin1;
	  if(ftrend<0 && fmax0>fmax1) fmax0=fmax1;

	  smax0=RSI0+2*StepSizeSlow;
	  smin0=RSI0-2*StepSizeSlow;

	  if (RSI0>smax1)  strend=1;
	  if (RSI0<smin1)  strend=-1;

	  if(strend>0 && smin0<smin1) smin0=smin1;
	  if(strend<0 && smax0>smax1) smax0=smax1;


	  Line1Buffer[shift]=RSI0;

	  if (ftrend>0) Line2Buffer[shift]=fmin0+StepSizeFast;
	  if (ftrend<0) Line2Buffer[shift]=fmax0-StepSizeFast;

	  if (strend>0) Line3Buffer[shift]=smin0+StepSizeSlow;
	  if (strend<0) Line3Buffer[shift]=smax0-StepSizeSlow;

	  fmin1=fmin0;
	  fmax1=fmax0;
	  smin1=smin0;
	  smax1=smax0;
	 }
	return(0);
 }
Comments