MonthlyPivot
Download script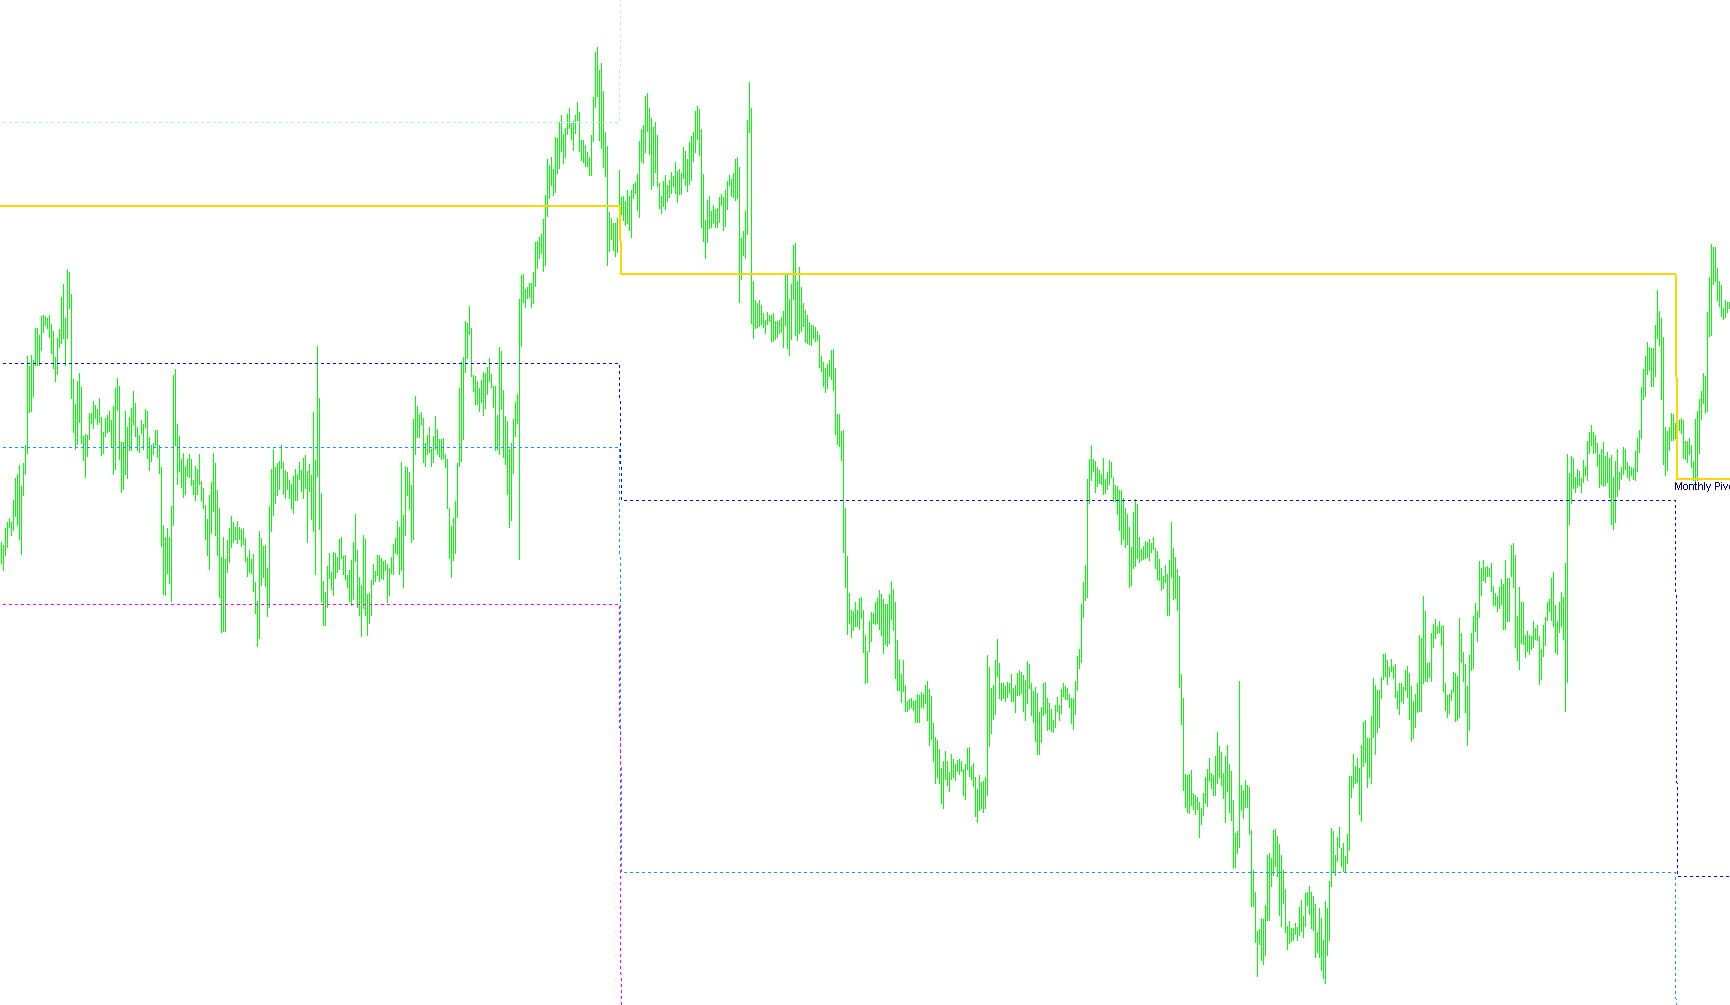
This script is a technical analysis tool designed for the MetaTrader platform to automatically calculate and display Monthly Pivot Points. These are essential levels used by traders to identify potential areas of support (where prices might stop falling) and resistance (where prices might stop rising) on a monthly basis.
Core Functionality
The tool scans historical price data to determine specific price benchmarks for the current month. It calculates a "Pivot Point" (the central balance price) and three distinct levels for both Support and Resistance (S1, S2, S3 and R1, R2, R3).
How the Logic Works
To provide accurate data, the script follows a specific logical sequence:
- Timeframe Restriction: The tool is designed to function specifically on lower timeframes (such as daily charts). If a user attempts to view it on a timeframe larger than a day, the script will not execute.
- Data Identification: The logic identifies the transition between months. It looks for the specific point where the previous month ends and the current month begins.
- Calculation Engine: Once the turn of the month is detected, the script gathers the highest price, the lowest price, and the closing price from the preceding month, along with the opening price of the new month. It then applies a mathematical formula to generate seven distinct levels:
- The Pivot Point (P): The primary baseline for the month's price action.
- Support Levels (S1, S2, S3): Calculated downward from the pivot to show where buying interest is historically likely to emerge.
- Resistance Levels (R1, R2, R3): Calculated upward from the pivot to show where selling pressure is likely to increase.
- Dynamic Updating: As the current month progresses, the script continuously monitors the "running" high and low prices. This ensures that the support and resistance levels remain relevant as new price extremes are reached throughout the month.
Visual Output
The script automatically draws these levels directly onto your trading chart as lines. It also includes text labels (such as "mS 1", "mR 2", etc.) to ensure that the user can easily distinguish between the different support and resistance boundaries at a glance.
//+------------------------------------------------------------------+
//|                                                    Monthly Pivot |
//|                                    Copyright © 2006, Profitrader |
//|                                    Coded/Verified by Profitrader |
//+------------------------------------------------------------------+
#property copyright "Copyright © 2006, Profitrader."
#property link      "profitrader@inbox.ru"

#property indicator_chart_window
#property indicator_buffers 7
#property indicator_color1 Navy
#property indicator_color2 White
#property indicator_color3 White
#property indicator_color4 White
#property indicator_color5 White
#property indicator_color6 White
#property indicator_color7 White
//---- buffers
double PBuffer[];
double S1Buffer[];
double R1Buffer[];
double S2Buffer[];
double R2Buffer[];
double S3Buffer[];
double R3Buffer[];

double P,S1,R1,S2,R2,S3,R3,last_month_high,last_month_low,last_month_close,this_month_open;
//+------------------------------------------------------------------+
//| Custom indicator initialization function                         |
//+------------------------------------------------------------------+
int init()
  {
   SetIndexBuffer(0,PBuffer);
   SetIndexBuffer(1,S1Buffer);
   SetIndexBuffer(2,R1Buffer);
   SetIndexBuffer(3,S2Buffer);
   SetIndexBuffer(4,R2Buffer);
   SetIndexBuffer(5,S3Buffer);
   SetIndexBuffer(6,R3Buffer);
   SetIndexStyle(0,DRAW_LINE,0,2);
   SetIndexStyle(1,DRAW_LINE,2,1);
   SetIndexStyle(2,DRAW_LINE,2,1);
   SetIndexStyle(3,DRAW_LINE,2,1);
   SetIndexStyle(4,DRAW_LINE,2,1);
   SetIndexStyle(5,DRAW_LINE,2,1);
   SetIndexStyle(6,DRAW_LINE,2,1);
   SetIndexLabel(0,"Monthly Pivot Point");
   SetIndexLabel(1,"Monthly Support 1");
   SetIndexLabel(2,"Monthly Resistant 1");
   SetIndexLabel(3,"Monthly Support 2");
   SetIndexLabel(4,"Monthly Resistant 2");
   SetIndexLabel(5,"Monthly Support 3");
   SetIndexLabel(6,"Monthly Resistant 3");
   return(0);
  }
//+------------------------------------------------------------------+
//| Custor indicator deinitialization function                       |
//+------------------------------------------------------------------+
int deinit()
  {
   ObjectDelete("Monthly Pivot");
   ObjectDelete("Monthly Sup1");
   ObjectDelete("Monthly Res1");
   ObjectDelete("Monthly Sup2");
   ObjectDelete("Monthly Res2");
   ObjectDelete("Monthly Sup3");
   ObjectDelete("Monthly Res3");
   return(0);
  }
//+------------------------------------------------------------------+
//| Custom indicator iteration function                              |
//+------------------------------------------------------------------+
int start()
  {
   int i,counted_bars=IndicatorCounted();
//---- check for possible errors
   if(counted_bars<0) return(-1);
//---- last counted bar will be recounted
   if(counted_bars>0) counted_bars--;
   int limit=Bars-counted_bars;

   if(Period()>PERIOD_D1) return(-1);
   if(counted_bars==0)
     {
      ObjectCreate("Monthly Pivot",OBJ_TEXT,0,0,0);
      ObjectSetText("Monthly Pivot","                            Monthly Pivot Point",8,"Arial",Navy);
      ObjectCreate("Monthly Sup1",OBJ_TEXT,0,0,0);
      ObjectSetText("Monthly Sup1","        mS 1",8,"Arial",White);
      ObjectCreate("Monthly Res1",OBJ_TEXT,0,0,0);
      ObjectSetText("Monthly Res1","        mR 1",8,"Arial",White);
      ObjectCreate("Monthly Sup2",OBJ_TEXT,0,0,0);
      ObjectSetText("Monthly Sup2","        mS 2",8,"Arial",White);
      ObjectCreate("Monthly Res2",OBJ_TEXT,0,0,0);
      ObjectSetText("Monthly Res2","        mR 2",8,"Arial",White);
      ObjectCreate("Monthly Sup3",OBJ_TEXT,0,0,0);
      ObjectSetText("Monthly Sup3","        mS 3",8,"Arial",White);
      ObjectCreate("Monthly Res3",OBJ_TEXT,0,0,0);
      ObjectSetText("Monthly Res3","        mR 3",8,"Arial",White);
     }
   for(i=limit-1; i>=0; i--)
      {
       // 1sts Days of Month
	    if(TimeDay(Time[i])<=3 && TimeDay(Time[i+1])>=26)
	      {
		    last_month_close=Close[i+1];
		    this_month_open=Open[i];
		    P=(last_month_high+last_month_low+last_month_close+this_month_open)/4;
          R1=(2*P)-last_month_low;
          S1=(2*P)-last_month_high;
          R2=P+(last_month_high-last_month_low);
          S2=P-(last_month_high-last_month_low);
          R3=(2*P)+(last_month_high-(2*last_month_low));
          S3=(2*P)-((2*last_month_high)-last_month_low);
        	 ObjectMove("Monthly Pivot",0,Time[i],P);
          ObjectMove("Monthly Sup1",0,Time[i],S1);
          ObjectMove("Monthly Res1",0,Time[i],R1);
          ObjectMove("Monthly Sup2",0,Time[i],S2);
          ObjectMove("Monthly Res2",0,Time[i],R2);
          ObjectMove("Monthly Sup3",0,Time[i],S3);
          ObjectMove("Monthly Res3",0,Time[i],R3);
          last_month_low=Low[i];
          last_month_high=High[i];
         }
       last_month_low=MathMin(last_month_low,Low[i]);
       last_month_high=MathMax(last_month_high,High[i]);
       PBuffer[i]=P;
       S1Buffer[i]=S1;
       R1Buffer[i]=R1;
       S2Buffer[i]=S2;
       R2Buffer[i]=R2;
       S3Buffer[i]=S3;
       R3Buffer[i]=R3;
      }
//----
   return(0);
  }
//+------------------------------------------------------------------+
Comments