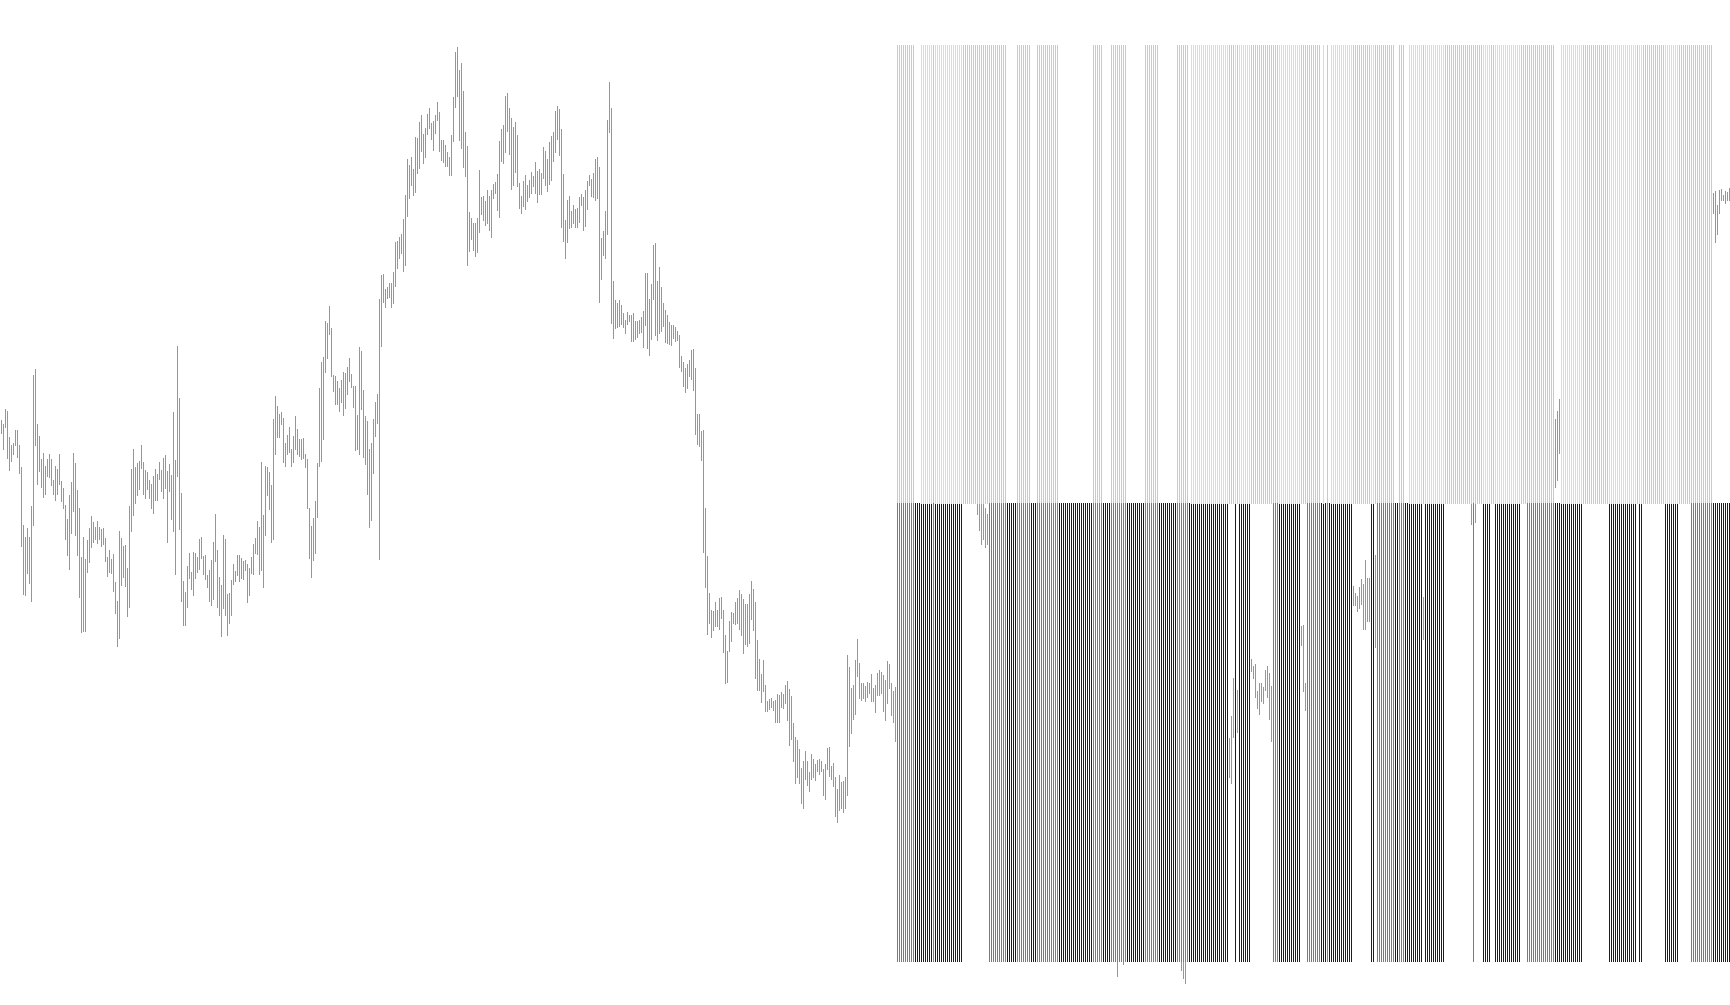
This tool is a specialized technical analysis indicator designed to help traders visualize market momentum by blending data from different timeframes into a single view. It focuses on the MACD (Moving Average Convergence Divergence)—a popular momentum oscillator—but adds a layer of logic to make it easier to interpret at a glance.
Core Functionality
The primary purpose of this script is to allow you to view MACD data from a higher time scale while staying on your current chart. For example, if you are trading on a 1-minute chart but want to see the momentum trends of the 1-hour or Daily charts, this tool handles that "multi-timeframe" translation automatically.
How the Logic Works
The script monitors two specific components of the MACD: the Main Line (which shows the general trend) and the Signal Line (which acts as a smoothed average of the main line). It then applies four distinct sets of rules to generate visual signals on your screen:
- Trend Strength (Positive): The script identifies instances where the Signal Line is above the Main Line. When this occurs, it highlights a specific visual bar, indicating positive momentum.
- Trend Strength (Negative): Conversely, it detects when the Signal Line falls below the Main Line, highlighting a different bar to indicate downward momentum.
- Bullish Momentum with Resistance: The tool looks for specific combinations where the Signal Line is below the Main Line, but the Main Line itself remains above the zero mark. This helps in identifying specific structural movements in a bullish environment.
- Bearish Momentum with Support: Similarly, it identifies instances where the Signal Line is above the Main Line while the Main Line stays below the zero mark, highlighting momentum shifts in a bearish environment.
User Experience Summary
Instead of forcing you to manually switch between different charts to see what the "big picture" looks like, this script simplifies the process. It processes the raw mathematical data of the MACD across your chosen timeframe and converts it into four distinct colored histograms. This allows you to stay on your primary trading chart while simultaneously receiving visual confirmation of momentum shifts from larger market cycles.
//+------------------------------------------------------------------+
//|                                                MTF_MACD_Bars.mq4 |
//|                      Copyright © 2006, MetaQuotes Software Corp. |
//|                                        http://www.metaquotes.net |
//+------------------------------------------------------------------+
#property copyright "Copyright © 2006, MetaQuotes Software Corp."
#property link      "http://www.metaquotes.net"
//+------------------------------------------------------------------+
//|                                                    FlatTrend.mq4 |
//|                                                       Kirk Sloan |
//|                                        http://www.metaquotes.net |
//+------------------------------------------------------------------+
#property copyright "Kirk Sloan"
#property link      "http://www.metaquotes.net"
#property link      "Modified by cja"
//----
#property indicator_separate_window
#property indicator_minimum -1
#property indicator_maximum 1
#property indicator_buffers 4
#property indicator_color1 Tomato
#property indicator_color2 YellowGreen
#property indicator_color3 Green
#property indicator_color4 Red
#property indicator_width1 4
#property indicator_width2 4
#property indicator_width3 4
#property indicator_width4 4
//---- input parameters
extern int Minutes=0;
extern int MACD_Fast=8;
extern int MACD_Slow=17;
extern int MACD_MA=9;
//---- buffers
double ExtMapBuffer1[];
double ExtMapBuffer2[];
double ExtMapBuffer3[];
double ExtMapBuffer4[];
/*double Ma;
double hhigh, llow;
double Psar;
double MA1,MA2,MA3;
double PADX,NADX;*/
string TimeFrameStr;
double MACD_Signal,MACD_Main;
//+------------------------------------------------------------------+
//| Custom indicator initialization function                         |
//+------------------------------------------------------------------+
int init()
  {
//---- indicators
   SetIndexStyle(0,DRAW_HISTOGRAM,STYLE_SOLID);
   SetIndexBuffer(0,ExtMapBuffer1);
   SetIndexStyle(1,DRAW_HISTOGRAM,STYLE_SOLID);
   SetIndexBuffer(1,ExtMapBuffer2);
   SetIndexStyle(2,DRAW_HISTOGRAM,STYLE_SOLID);
   SetIndexBuffer(2,ExtMapBuffer3);
   SetIndexStyle(3,DRAW_HISTOGRAM,STYLE_SOLID);
   SetIndexBuffer(3,ExtMapBuffer4);
//----
   switch(Minutes)
     {
      case 1 : TimeFrameStr="Period_M1"; break;
      case 5 : TimeFrameStr="Period_M5"; break;
      case 15 : TimeFrameStr="Period_M15"; break;
      case 30 : TimeFrameStr="Period_M30"; break;
      case 60 : TimeFrameStr="Period_H1"; break;
      case 240 : TimeFrameStr="Period_H4"; break;
      case 1440 : TimeFrameStr="Period_D1"; break;
      case 10080 : TimeFrameStr="Period_W1"; break;
      case 43200 : TimeFrameStr="Period_MN1"; break;
      default : TimeFrameStr="Current Timeframe"; Minutes=0;
     }
   IndicatorShortName("MTF_MACD ("+TimeFrameStr+")");
//----
   return(0);
  }
//+------------------------------------------------------------------+
//| Custom indicator deinitialization function                       |
//+------------------------------------------------------------------+
int deinit()
  {
//----
//----
   return(0);
  }
//+------------------------------------------------------------------+
//| Custom indicator iteration function                              |
//+------------------------------------------------------------------+
int start()
  {
   int    counted_bars=IndicatorCounted();
//----
     for(int i=0; i < 300; i++)
     {
      ExtMapBuffer1[i]=0;
      ExtMapBuffer2[i]=0;
      ExtMapBuffer3[i]=0;
      ExtMapBuffer4[i]=0;
//----
      MACD_Signal=iMACD(NULL,Minutes,MACD_Fast,MACD_Slow,MACD_MA,PRICE_CLOSE,MODE_SIGNAL,i);
      MACD_Main  =iMACD(NULL,Minutes,MACD_Fast,MACD_Slow,MACD_MA,PRICE_CLOSE,MODE_MAIN,i);
//----
      if(MACD_Signal < MACD_Main )ExtMapBuffer2[i]=-1;//Sig Below MACD
      if(MACD_Signal > MACD_Main )ExtMapBuffer1[i]=1;//Sig above MACD
  /* if(ExtMapBuffer1[i] == 0 && ExtMapBuffer2[i] == 0)
   {ExtMapBuffer3[i] = 1;}*/
      if(MACD_Signal < MACD_Main && MACD_Main > 0)ExtMapBuffer3[i]=1;//Sig below MACD & Above 0
      if(MACD_Signal > MACD_Main && MACD_Main < 0)ExtMapBuffer4[i]=-1;//Sig above MACD & Below 0
     }
//----
   return(0);
  }
//+------------------------------------------------------------------+
Comments