Speed5_001
Download script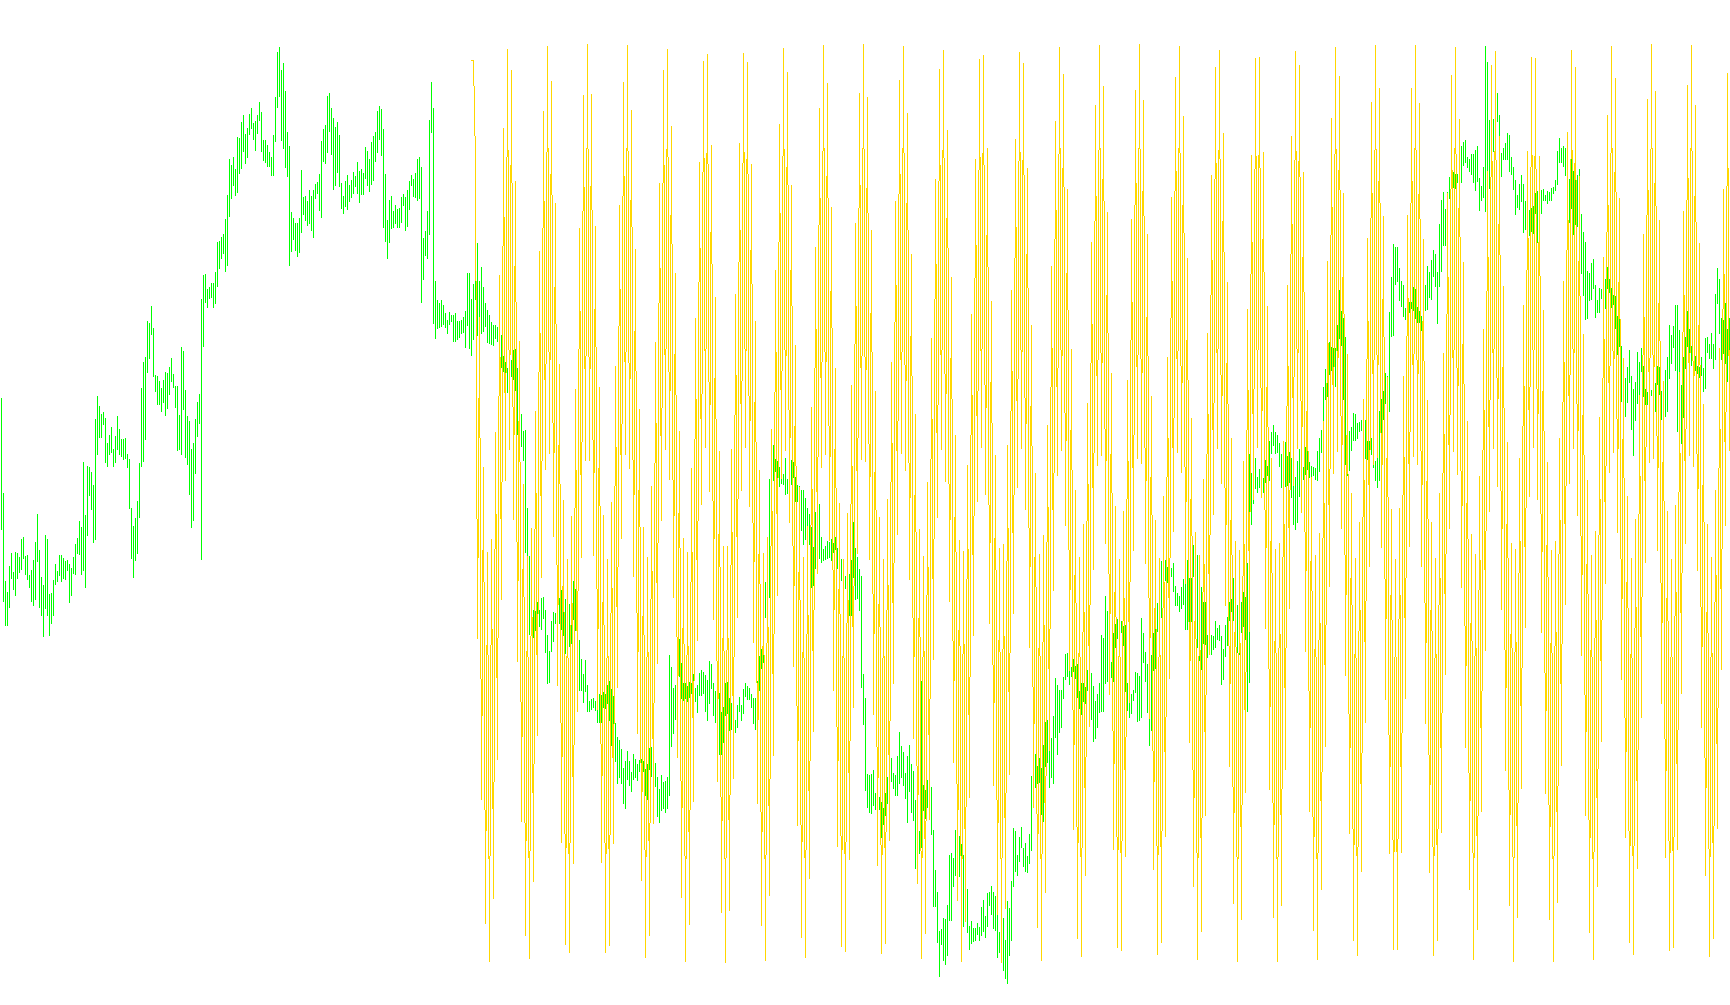
This script is designed to function as a technical indicator for trading platforms, specifically intended to visualize market momentum or "speed" through a dedicated separate window. Rather than plotting price directly, it generates a visual representation based on the relationship between historical data points and mathematical cycles.
Core Logic Overview
The script operates by scanning through historical price data and calculating values based on the following logical steps:
1. Data Sampling The tool examines a specific range of history (roughly half of the available bars on the chart). For each point in this range, it looks back at three consecutive candles to gather information on high, low, open, close, volume, and the minimum price movement (pips).
2. Variable Calculation While the script identifies several specific market variables—such as the rate of change between closing prices relative to volume changes—the primary visual output is driven by a trigonometric calculation. It uses a Cosine function applied to the index of the current bar divided by the price point. This creates a periodic, wave-like movement.
3. Momentum Tracking To refine the visual output, the script applies a "differential" logic. Instead of simply showing the raw value of the calculation at each moment, it subtracts the value of the previous period from the current one. This highlights the change in speed rather than just the absolute position.
Visual Representation
The result is plotted as two distinct lines:
- Light Sea Green Line: Represents the primary calculated trend.
- Red Line: Acts as a secondary data buffer within the indicator window.
Summary for the User
Essentially, this script acts as a mathematical "oscillator." It takes the raw history of the market and converts it into a smooth, repeating wave pattern that identifies shifts in momentum. By subtracting previous values from current ones, the indicator aims to highlight the acceleration or deceleration of price movements over time, providing a smoothed visual of how fast the market is moving in a specific direction.
//+------------------------------------------------------------------+
//|                                                 Speed.mq4        |
//|                      Copyright © 2005, MetaQuotes Software Corp. |
//|                                       http://www.metaquotes.net/ |
//+------------------------------------------------------------------+
#property copyright "Copyright © 2005, MetaQuotes Software Corp."
#property link      "http://www.metaquotes.net/"

#property indicator_separate_window
#property indicator_buffers 2
#property indicator_color1 LightSeaGreen
#property indicator_color2 Red
//---- buffers
double ExtMapBuffer1[];
double ExtMapBuffer2[];
//+------------------------------------------------------------------+
//| Custom indicator initialization function                         |
//+------------------------------------------------------------------+
int init()
  {
   IndicatorShortName("");
//---- indicators
   SetIndexStyle(0,DRAW_LINE);
   SetIndexBuffer(0,ExtMapBuffer1);
   SetIndexStyle(1,DRAW_LINE);
   SetIndexBuffer(1,ExtMapBuffer2);

//----
   return(0);
  }
//+------------------------------------------------------------------+
//| Accumulation/Distribution                                        |
//+------------------------------------------------------------------+
int start()
  {
   int i,n,Bars1,counted_bars=IndicatorCounted();
   RefreshRates();
//----
   //i=0;
   //n=Bars-counted_bars-1;
   //while(i<=n)
   Bars1=Bars/2;
   i=Bars1;//Bars-counted_bars-1;
   while(i>=0)
   {
      double high0 =High[i];
      double low0  =Low[i];
      double open0 =Open[i];
      double close0=Close[i];
      double pips0=close0/Point;
      double vol0=Volume[i];

      double high1 =High[i+1];
      double low1  =Low[i+1];
      double open1 =Open[i+1];
      double close1=Close[i+1];
      double pips1=close1/Point;
      double vol1=Volume[i+1];

      double high2 =High[i+2];
      double low2  =Low[i+2];
      double open2 =Open[i+2];
      double close2=Close[i+2];
      double pips2=close2/Point;
      double vol2=Volume[i+2];


      double vit1=(close0-close1)/(vol0-vol1);
      double vit2=(close1-close2)/(vol1-vol2);

      double vit3=(high0-low0)/(vol0-vol1);
      double vit4=(high1-low1)/(vol1-vol2);
      //ExtMapBuffer1[i]=ExtMapBuffer1[i+1]+Volume[i];
      ExtMapBuffer1[i]=MathCos(2*3.1415*i/Point);//(close0-close1);//iMACD(NULL,0,14,26,9,PRICE_CLOSE,MODE_MAIN,0)-iMACD(NULL,0,14,26,9,PRICE_CLOSE,MODE_MAIN,1);//buy //-vit4;  //(close-low)-(high-close);
      //ExtMapBuffer2[i]=-i;//vit3*20;//-(iMACD(NULL,0,14,26,9,PRICE_CLOSE,MODE_MAIN,0)-iMACD(NULL,0,14,26,9,PRICE_CLOSE,MODE_MAIN,1));//sell
      /*
      if(ExtMapBuffer1[i]!=0)
      {
         double diff=high-low;
         if(0==diff)
            ExtMapBuffer1[i]=0;
         else
         {
            ExtMapBuffer1[i]/=diff;
            ExtMapBuffer1[i]*=Volume[i];
         }
      }*/
      if(i<Bars1-1)
      {
        ExtMapBuffer1[i]-=ExtMapBuffer1[i+1];
        //ExtMapBuffer2[i]-=ExtMapBuffer2[i+1];
      }


      i--;
     }
//----
   return(0);
  }
//+------------------------------------------------------------------+
Comments