nd2StopLine_v1
Download script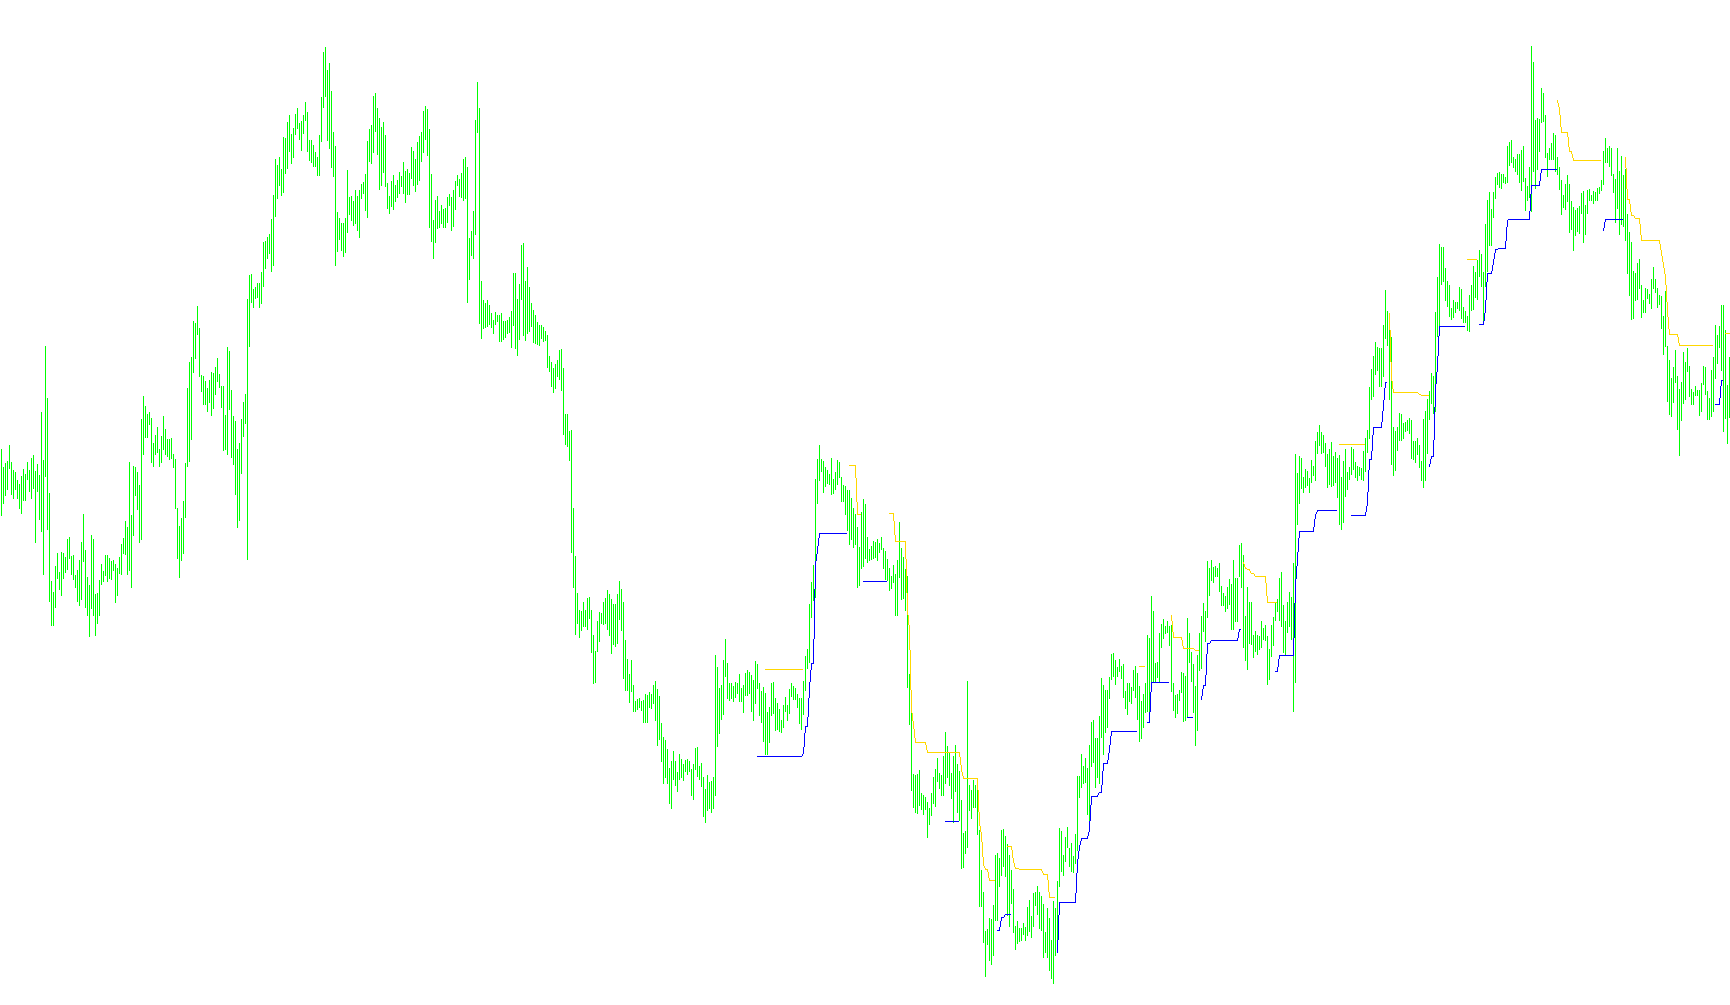
This technical indicator, known as BrainTrend1StopLine, is designed to assist traders in identifying the underlying momentum and direction of a financial market. It works by smoothing out price fluctuations to highlight whether the current "trend" is moving upward or downward, while simultaneously providing a dynamic boundary for potential price movements.
Here is a breakdown of how the logic functions in plain English:
1. Calculating Market Volatility
Before determining the trend, the script first analyzes recent price history to understand the "mood" of the market. It looks at a specific number of previous candles (the Average Period) and calculates the average range between the highs and lows. This calculation helps the indicator understand how much the price typically swings during normal conditions, creating a mathematical constant used to set the distance for the trend lines.
2. Identifying the Trend Direction
The indicator evaluates the relationship between the opening and closing prices of the candles. It essentially "scans" the history to determine the dominant direction:
- Bullish Momentum: When the market shows upward strength, the script identifies an ascending trend.
- Bearish Momentum: When the market shows downward strength, the script identifies a descending trend.
3. Dynamic Line Drawing (The "Stop Line")
Instead of simply following the price exactly, the indicator draws two distinct lines on your chart (represented in Red and Blue). These lines act as trailing boundaries:
- Resistance/Support Tracking: As the price moves in a certain direction, the indicator tracks the highest or lowest points reached. It then projects a line at a specific distance from those points based on the volatility calculated in step one.
- Trend Flipping: The logic is designed to "flip" automatically. If the price breaks through the current trend line and moves aggressively in the opposite direction, the indicator recognizes this as a change in market sentiment. It will then switch the active line from the bearish color to the bullish color (or vice versa), effectively "resetting" the boundary to match the new movement.
4. Summary for the User
For a trader, this script serves as a visual guide to price flow. Rather than getting distracted by minor "noise" or small fluctuations in price, the BrainTrend1StopLine helps you see the broader path. It provides a visual cue of where the current trend is heading and marks a dynamic threshold; if the price stays on one side of the line, the trend is intact. If it breaks through to the other side, it signals that the market may be shifting into a new phase.
/*-----------------------------+
|			       |
| Shared by www.Aptrafx.com    |
|			       |
+------------------------------*/

//+-----------------------------------------------------------------------+
//|                                               BrainTrend1StopLine.mq4 |
//|                                   Copyright © 2005. Alejandro Galindo |
//|                                                   http://elCactus.com |
//+-----------------------------------------------------------------------+

#property indicator_chart_window
#property indicator_buffers 2
#property indicator_color1 Red
#property indicator_color2 Blue

//---- input parameters
extern int AveragePeriod=10;
extern int Reg=1;

//---- buffers
double Buffer1[];
double Buffer2[];

//+------------------------------------------------------------------+
//| Custom indicator initialization function                         |
//+------------------------------------------------------------------+
int init()
  {
//---- indicator line
   IndicatorBuffers(2);
   SetIndexStyle(0,DRAW_LINE);
   SetIndexStyle(1,DRAW_LINE);
   SetIndexBuffer(0,Buffer1);
   SetIndexBuffer(1,Buffer2);

//----
   return(0);
  }
//+------------------------------------------------------------------+
//| BrainTrend1Stop                                                  |
//+------------------------------------------------------------------+
int start()
  {

   int i,shift,counted_bars=IndicatorCounted();
   double value=0, price=0, trend=0, dK=0, AvgRange=0, WATR=0;
   int bar=0;
   int CountBars=500;
   if (CountBars>=Bars) CountBars=Bars;
   SetIndexDrawBegin(0,Bars-CountBars+11+1);
   SetIndexDrawBegin(1,Bars-CountBars+11+1);

//---- initial zero
   AvgRange=0;
   for (i=1;i<=AveragePeriod;i++)
   {
      dK = 1+(AveragePeriod-i)/AveragePeriod;
      AvgRange=AvgRange+ dK*MathAbs(High[i]-Low[i]);
   }
   if (Point>=0.01) { WATR = (AvgRange/AveragePeriod)*Point; }
   else { WATR = AvgRange/AveragePeriod; }


   if (Close[Bars-1] > Open[Bars-1])
   {
      value = Close[Bars - 1] * (1 - WATR);
      trend = 1;
      Buffer2[Bars-1]=value;
   }
   if (Close[Bars-1] < Open[Bars-1])
   {
      value = Close[Bars - 1] * (1 + WATR);
      trend = -1;
      Buffer1[Bars-1]=value;
   }

   bar=CountBars-11-2;
   while(bar>=0)
   {

//   Buffer1[shift]=0;
//   Buffer2[shift]=0;


   if (Reg==2)
   {
      AvgRange=0;
      for (i=1;i<=AveragePeriod;i++)
      {
         dK = 1+(AveragePeriod-i)/AveragePeriod;
         AvgRange=AvgRange+ dK*MathAbs(High[bar + i]-Low[bar + i]);
      }
      if (Point>=0.01) { WATR = (AvgRange/AveragePeriod)*Point; }
      else { WATR = AvgRange/AveragePeriod; }

   }

   if (trend >= 0)
   {
      if (Close[bar] > price) { price = Close[bar]; }
      value = price * (1 - WATR);
      if (Close[bar] < value)
      {
          price = Close[bar];
          value = price * (1 + WATR);
          trend = -1;
       }
    } else {
      if (trend <= 0) {
         if (Close[bar] < price) { price = Close[bar]; }
         value = price * (1 + WATR);
         if (Close[bar] > value)
         {
             price = Close[bar];
            value = price * (1 - WATR);
            trend = 1;
         }
      }
    }

   if (trend == -1) { Buffer1[bar]=value; }
   if (trend == 1) { Buffer2[bar]=value; }
//----

   bar--;
   }
   return(0);
  }
//+------------------------------------------------------------------+
Comments