nd1Stop_v1
Download script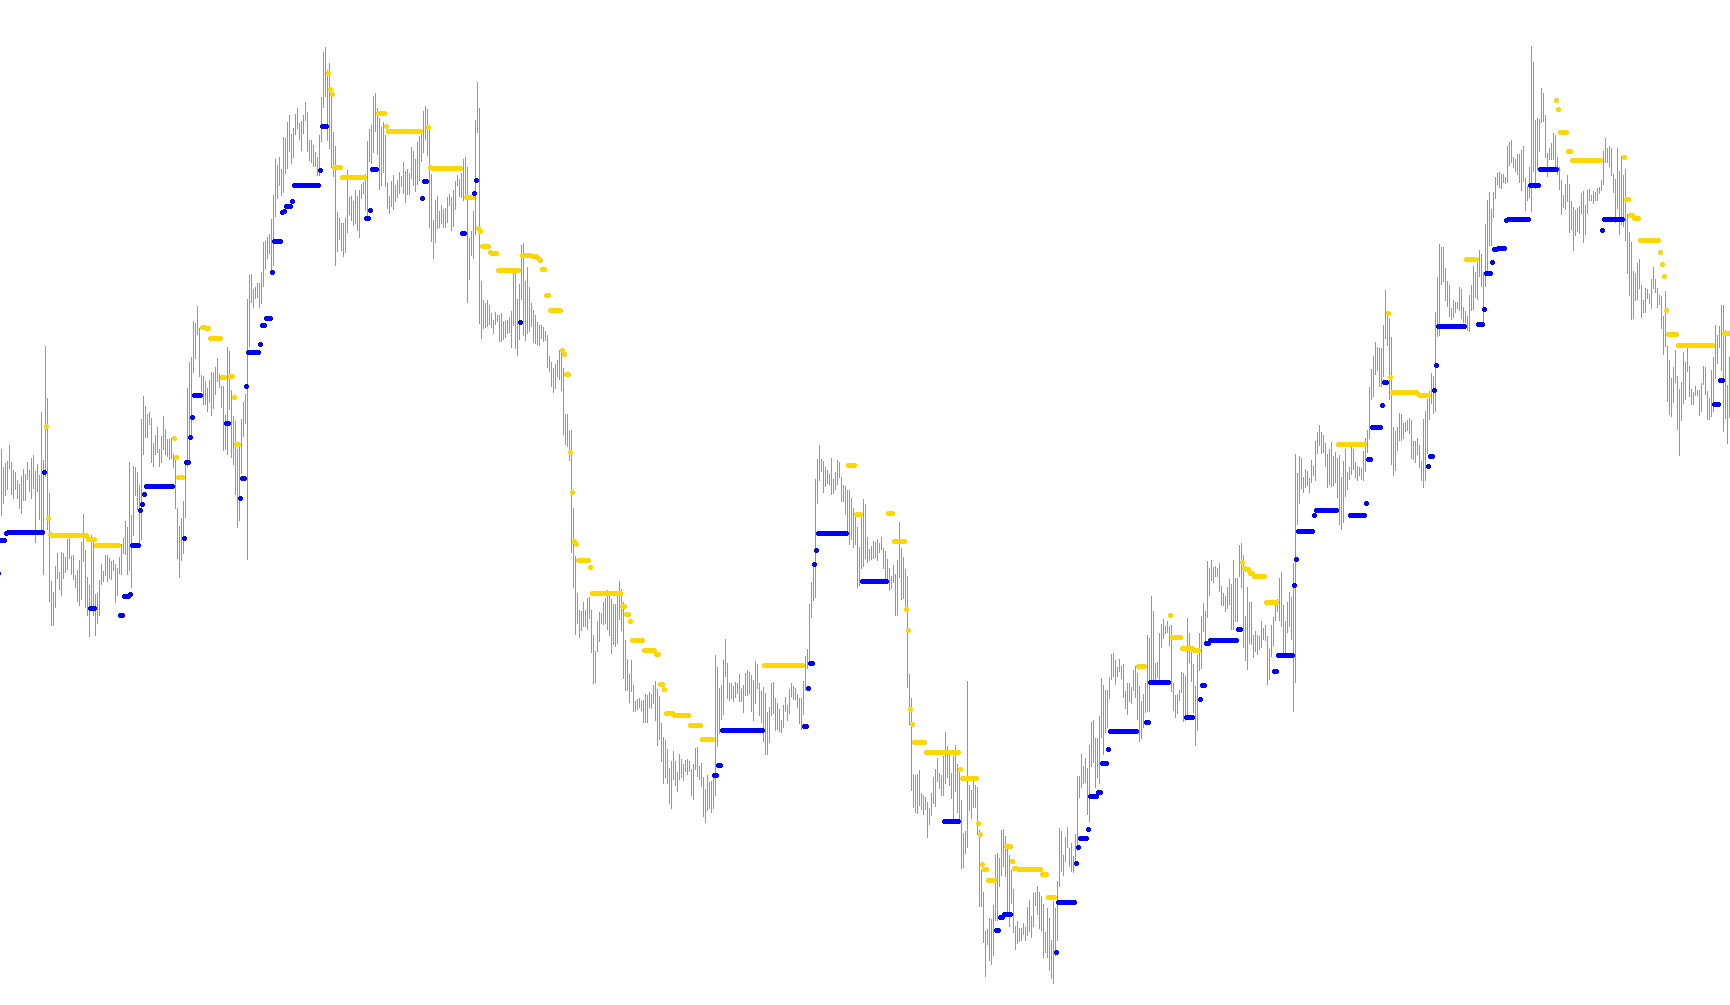
This tool is designed to help traders visualize market trends and identify potential reversal points by tracking price momentum. Instead of just showing you where the price is currently, it acts as a "trend follower" that calculates how far the price can deviate from its recent highs or lows before a shift in direction is signaled.
How the Logic Works
1. Dynamic Volatility Measurement The script starts by looking at a specific number of previous candles (defined by the "Average Period"). It measures the average range—the distance between the highest and lowest price points within those candles. By doing this, the tool adapts to the current market environment; it understands when the market is moving violently and when it is moving calmly, adjusting its sensitivity accordingly.
2. Trend Identification The tool establishes an initial direction based on whether a candle closed higher or lower than it opened.
- If the market is moving up, the script "locks" onto that trend.
- If the market is moving down, it tracks that downward momentum.
3. The "Stop" Mechanism (Price Tracking) Rather than just drawing a line that follows every tiny wiggle in price, this logic tracks the "extreme" points of the current trend.
- In an uptrend, it remembers the highest price reached so far. It then projects a theoretical threshold slightly below that high point based on the volatility it calculated earlier.
- In a downtrend, it remembers the lowest price reached and projects a threshold slightly above that low point.
4. Reversal Signaling The core "intelligence" of this script is how it handles a change in direction. It waits for the price to break through its own established threshold:
- If the price is in an uptrend but falls below the calculated threshold, the script recognizes this as a potential trend exhaustion and switches its status to a downtrend.
- Conversely, if the price is in a downtowntrend but breaks above the upward threshold, it switches back to an uptrend.
Visual Representation
On your chart, this logic manifests as two distinct indicators (represented by different colors). These markers act as trailing boundaries. When the trend is bullish, one color will appear; when the trend turns bearish and the "break" occurs, the script switches colors to reflect the new direction. This allows traders to see not just where the price is going, but the specific level at which the previous momentum has been broken.
/*-----------------------------+
|			       |
| Shared by www.Aptrafx.com    |
|			       |
+------------------------------*/

//+-----------------------------------------------------------------------+
//|                                                   BrainTrend1Stop.mq4 |
//|                                   Copyright © 2005. Alejandro Galindo |
//|                                                   http://elCactus.com |
//|                        Author := VG many thanks to Konkop and dupidu1 |
//+-----------------------------------------------------------------------+

#property indicator_chart_window
#property indicator_buffers 2
#property indicator_color1 Red
#property indicator_color2 Blue

//---- input parameters
extern int AveragePeriod=10;

//---- buffers
double Buffer1[];
double Buffer2[];

//+------------------------------------------------------------------+
//| Custom indicator initialization function                         |
//+------------------------------------------------------------------+
int init()
  {
//---- indicator line
   IndicatorBuffers(2);
   SetIndexStyle(0,DRAW_ARROW);
   SetIndexStyle(1,DRAW_ARROW);
   SetIndexBuffer(0,Buffer1);
   SetIndexBuffer(1,Buffer2);
   SetIndexArrow(0,159);
   SetIndexArrow(1,159);

//----
   return(0);
  }
//+------------------------------------------------------------------+
//| BrainTrend1Stop                                                  |
//+------------------------------------------------------------------+
int start()
  {

   int i,shift,counted_bars=IndicatorCounted();
   double value=0, price=0, trend=0, dK=0, AvgRange=0;
   int bar=0;
   int CountBars=20000;
   if (CountBars>=Bars) CountBars=Bars;
   SetIndexDrawBegin(0,Bars-CountBars+11+1);
   SetIndexDrawBegin(1,Bars-CountBars+11+1);

//---- initial zero
   AvgRange=0;
   for (i=1;i<=AveragePeriod;i++) { AvgRange+= MathAbs(High[i]-Low[i]); }
   if (Point>=0.01) { dK = (AvgRange/AveragePeriod)*Point; }
   else { dK = (AvgRange/AveragePeriod); }

   if (Close[Bars-1] > Open[Bars-1])
   {
      value = Close[Bars - 1] * (1 - dK);
      trend = 1;
      Buffer2[Bars-1]=value;
   }
   if (Close[Bars-1] < Open[Bars-1])
   {
      value = Close[Bars - 1] * (1 + dK);
      trend = -1;
      Buffer1[Bars-1]=value;
   }

   bar=CountBars-11-1;
   while(bar>=0)
   {

   Buffer1[shift]=0;
   Buffer2[shift]=0;

   if (trend >= 0)
   {
      if (Close[bar] > price) { price = Close[bar]; }
      value = price * (1 - dK);
      if (Close[bar] < value)
      {
          price = Close[bar];
          value = price * (1 + dK);
          trend = -1;
       }
    } else {
      if (trend <= 0) {
         if (Close[bar] < price) { price = Close[bar]; }
         value = price * (1 + dK);
         if (Close[bar] > value)
         {
             price = Close[bar];
            value = price * (1 - dK);
            trend = 1;
         }
      }
    }

   if (trend == -1) { Buffer1[bar]=value; }
   if (trend == 1) { Buffer2[bar]=value; }
//----

   bar--;
   }
   return(0);
  }
//+------------------------------------------------------------------+
Comments