nd1StopLine_v1
Download script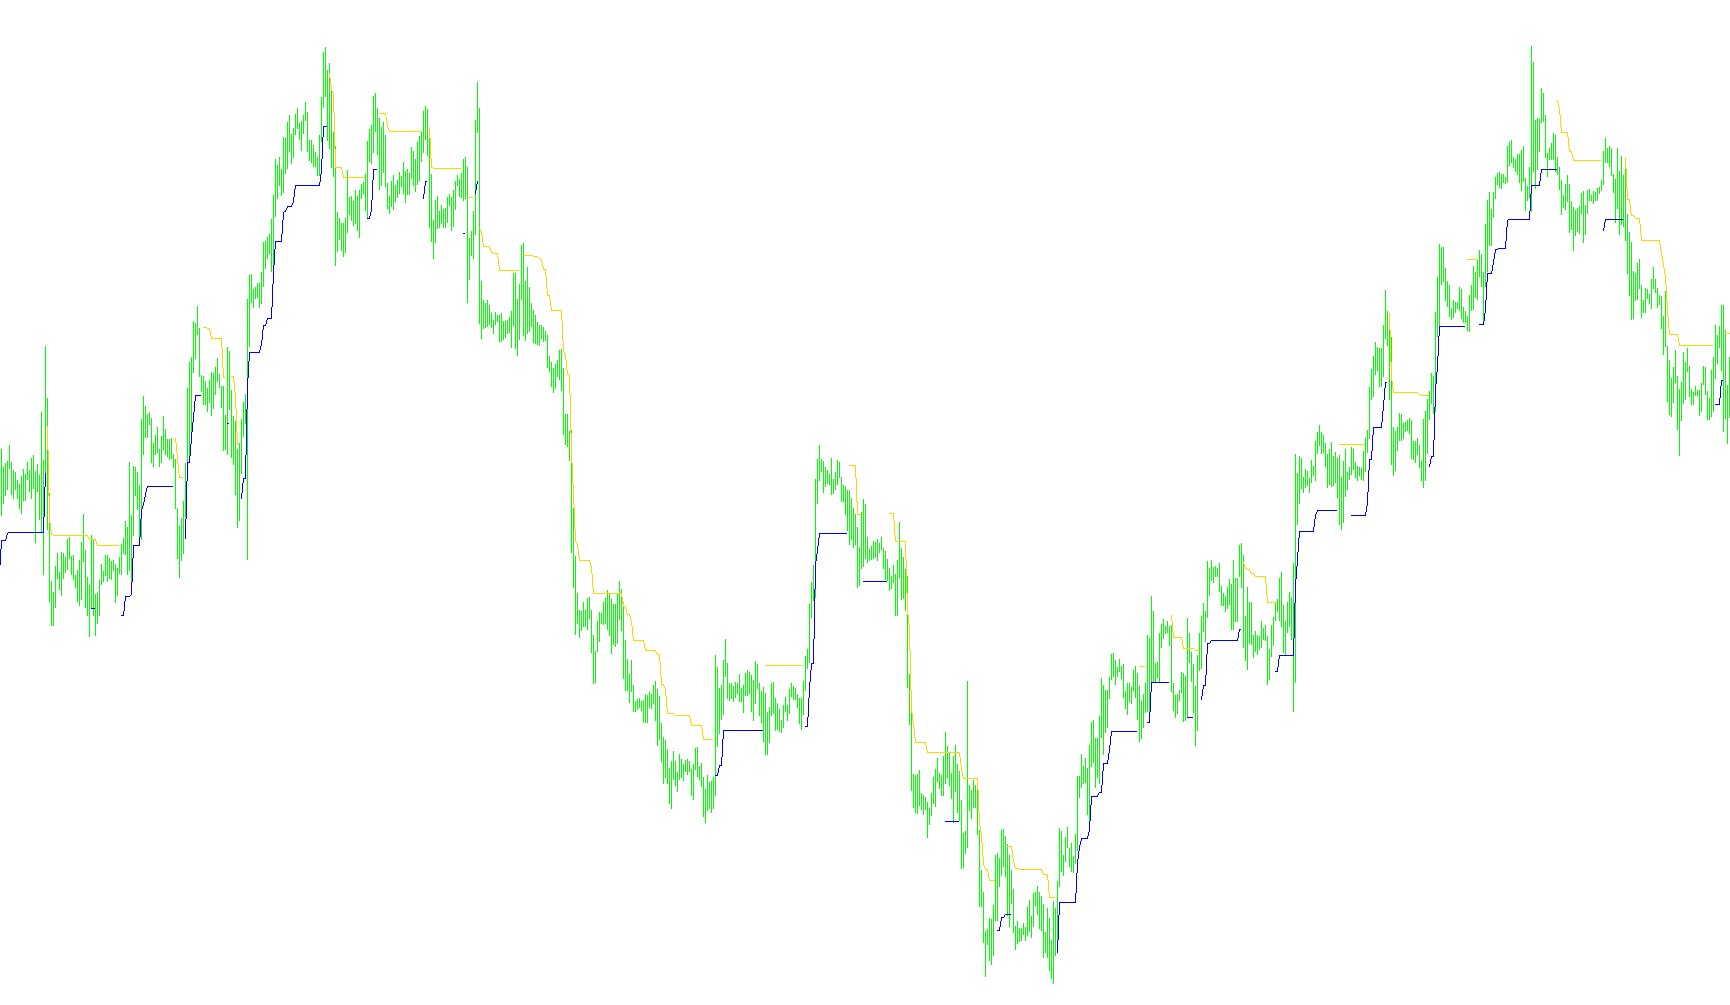
This technical indicator is designed to help traders visualize the prevailing trend of a financial market by identifying "stopping points" and shifts in momentum. It works by dynamically calculating the volatility of the market to establish boundaries that represent where a price trend might exhaust itself.
Core Logic and Methodology
1. Dynamic Volatility Assessment Before determining the trend, the script analyzes a specific look-back period (defined by the user) to measure how much the price typically fluctuates between its highs and lows. It takes this average range and converts it into a percentage-based "buffer." This ensures that the indicator adapts automatically to different market conditions—becoming more sensitive during quiet periods and wider during high-volatility swings.
2. Trend Detection and Momentum Tracking The script constantly monitors whether the price is moving upward or downward by comparing the closing price of a candle to its opening price.
- In an Uptrend: The logic tracks the highest price reached. It then projects a theoretical "stopping line" slightly below that peak based on the calculated volatility buffer.
- In a Downtrend: The logic tracks the lowest price reached and projects a "stopping line" slightly above that bottom.
3. Trend Reversal Mechanics The primary intelligence of this script lies in its ability to identify when a trend has lost its momentum.
- If the market is currently in an uptrend but the price falls below the dynamically projected stopping line, the script recognizes this as a potential shift and flips the trend to "down."
- Conversely, if the market is in a downtrend but the price breaks above the projected stopping line, it signals a flip back to an "up" trend.
4. Visual Representation The indicator provides two distinct lines on your chart:
- One line represents the current trajectory of an Uptrend.
- The other line represents the current trajectory of a Downtrend.
By following these lines, traders can see the "ceiling" or "floor" of the current move. When the script switches trends, the active line will reposition itself to reflect the new direction of the market price, providing a clear visual cue of where the trend has shifted and where new support or resistance may be forming.
/*-----------------------------+
|			       |
| Shared by www.Aptrafx.com    |
|			       |
+------------------------------*/

//+-----------------------------------------------------------------------+
//|                                               BrainTrend1StopLine.mq4 |
//|                                   Copyright © 2005. Alejandro Galindo |
//|                                                   http://elCactus.com |
//|                        Author := VG many thanks to Konkop and dupidu1 |
//+-----------------------------------------------------------------------+

#property indicator_chart_window
#property indicator_buffers 2
#property indicator_color1 Red
#property indicator_color2 Blue

//---- input parameters
extern int AveragePeriod=10;

//---- buffers
double Buffer1[];
double Buffer2[];

//+------------------------------------------------------------------+
//| Custom indicator initialization function                         |
//+------------------------------------------------------------------+
int init()
  {
//---- indicator line
   IndicatorBuffers(2);
   SetIndexStyle(0,DRAW_LINE);
   SetIndexStyle(1,DRAW_LINE);
   SetIndexBuffer(0,Buffer1);
   SetIndexBuffer(1,Buffer2);

//----
   return(0);
  }
//+------------------------------------------------------------------+
//| BrainTrend1Stop                                                  |
//+------------------------------------------------------------------+
int start()
  {

   int i,shift,counted_bars=IndicatorCounted();
   double value=0, price=0, trend=0, dK=0, AvgRange=0;
   int bar=0;
   int CountBars=20000;
   if (CountBars>=Bars) CountBars=Bars;
   SetIndexDrawBegin(0,Bars-CountBars+11+1);
   SetIndexDrawBegin(1,Bars-CountBars+11+1);

//---- initial zero
   AvgRange=0;
   for (i=1;i<=AveragePeriod;i++) { AvgRange+= MathAbs(High[i]-Low[i]); }
   // fixed to Work with JPY Symbols
   if (Point>=0.01) { dK = (AvgRange/AveragePeriod)*Point; }
   else { dK = (AvgRange/AveragePeriod); }
   if (Close[Bars-1] > Open[Bars-1])
   {
      value = Close[Bars - 1] * (1 - dK);
      trend = 1;
      Buffer2[Bars-1]=value;
   }
   if (Close[Bars-1] < Open[Bars-1])
   {
      value = Close[Bars - 1] * (1 + dK);
      trend = -1;
      Buffer1[Bars-1]=value;
   }

   bar=CountBars-11-1;
   while(bar>=0)
   {

   Buffer1[shift]=0;
   Buffer2[shift]=0;

   if (trend >= 0)
   {
      if (Close[bar] > price) { price = Close[bar]; }
      value = price * (1 - dK);
      if (Close[bar] < value)
      {
          price = Close[bar];
          value = price * (1 + dK);
          trend = -1;
       }
    } else {
      if (trend <= 0) {
         if (Close[bar] < price) { price = Close[bar]; }
         value = price * (1 + dK);
         if (Close[bar] > value)
         {
             price = Close[bar];
            value = price * (1 - dK);
            trend = 1;
         }
      }
    }

   if (trend == -1) { Buffer1[bar]=value; }
   if (trend == 1) { Buffer2[bar]=value; }
//----

   bar--;
   }
   return(0);
  }
//+------------------------------------------------------------------+
Comments