NRTR 1_v1
Download script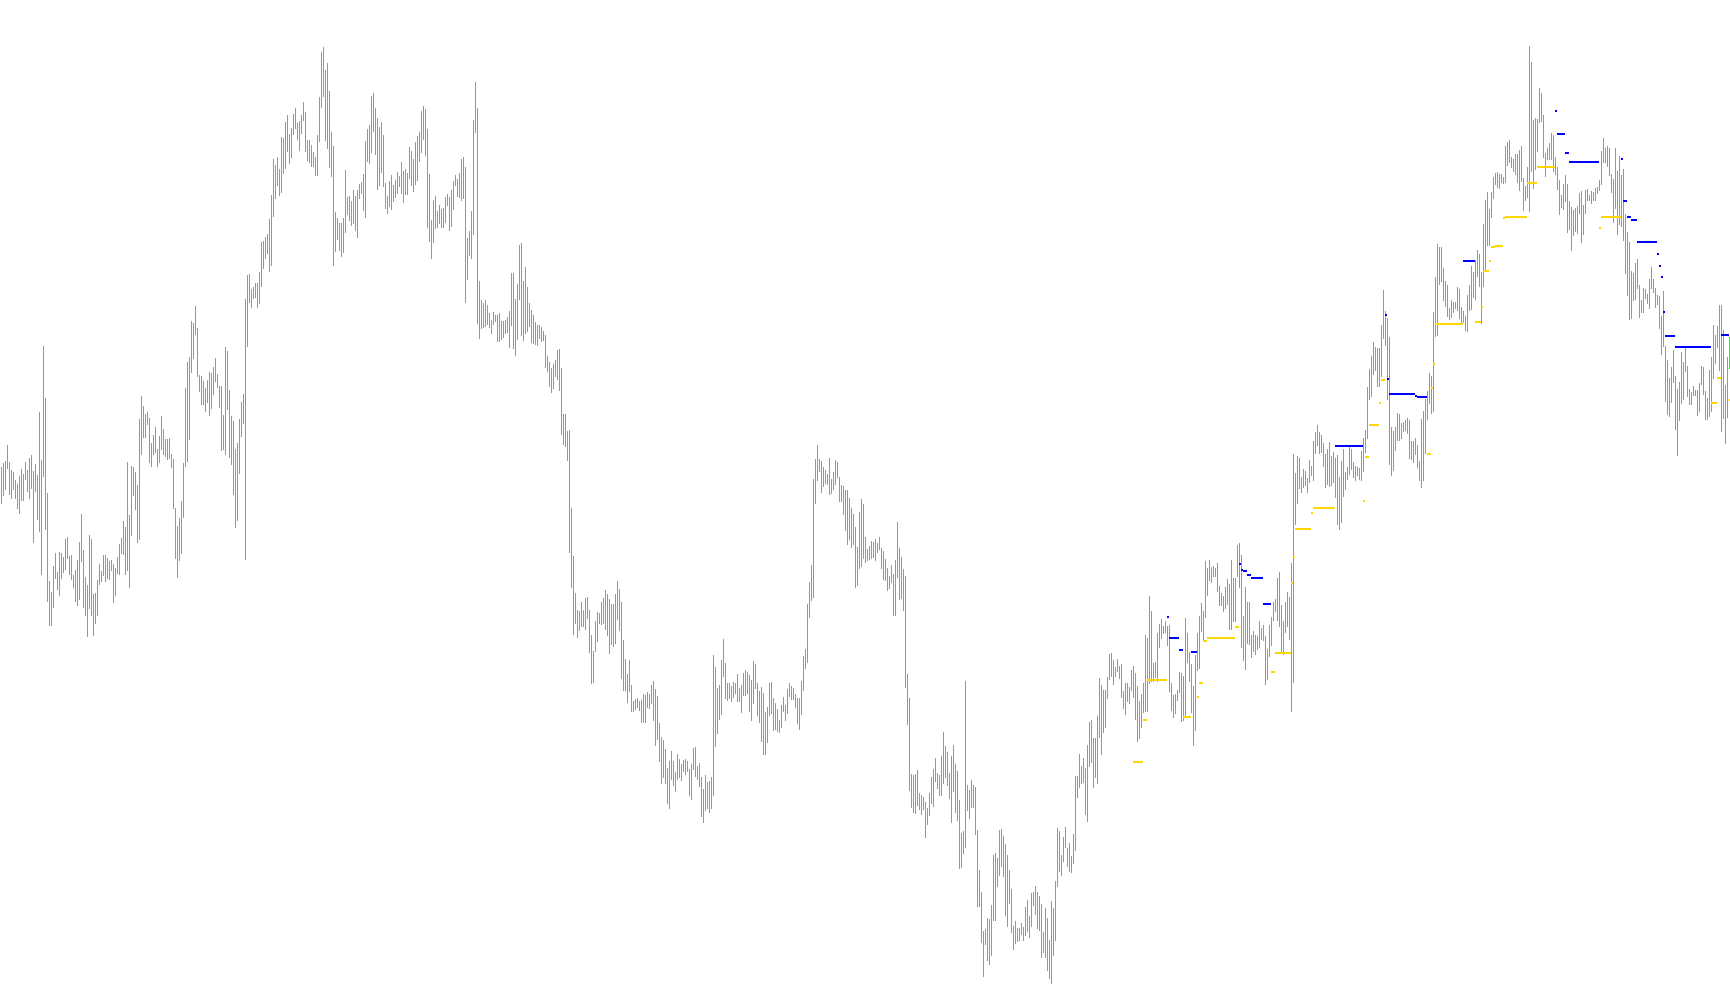
This script is designed as a technical analysis tool for MetaTrader, specifically built to identify and visualize market trend shifts and price movements on a trading chart. It functions by analyzing historical price data to determine the prevailing direction of the market and highlighting specific "pivot" points where these trends may change.
Core Logic Overview
The primary objective of the script is to track whether the current market sentiment is bullish (upward) or bearish (downward). It achieves this through a dynamic calculation of price volatility and a continuous monitoring of recent price action.
1. Volatility Calculation Before determining the trend, the script looks at a specific set of previous bars (defined by the user) to calculate an "Average Range." This represents the typical distance between the high and low prices during that period. This calculation is vital because it creates a sensitivity threshold; it tells the script how much the price needs to move before a trend change is considered "significant" rather than just normal market noise.
2. Adaptive Scaling The tool includes specific logic to handle different currency pairs. For certain Japanese Yen (JPY) pairs, it automatically scales down its calculations to account for different decimal precisions. This ensures that the indicator remains accurate and visually consistent regardless of which currency you are trading.
3. Trend Tracking & Reversal Detection The script works by "remembering" the most recent price peak or valley. It moves through the chart history and applies the following logic:
- In an Upward Trend: The script tracks the highest prices reached. If the current price drops significantly below a calculated threshold (based on that high price and the average volatility), it recognizes a potential trend reversal to the downside.
- In a Downward Trend: The script tracks the lowest prices reached. If the price rises significantly above a calculated threshold, it identifies a potential shift back to an upward trend.
4. Visual Representation Instead of drawing a continuous line, the script identifies these specific moments of reversal and marks them on your chart using visual arrows (colored Aqua and Violet). This allows traders to quickly see where the momentum shifted from bullish to bearish or vice versa.
Summary for the Trader
In simple terms, this tool acts as a "smart filter." It looks at how much the price usually moves, remembers the recent highs and lows, and places a visual marker on the chart whenever the price breaks out of its current path with enough force to suggest a new trend has begun. This helps in identifying potential entry or exit points by highlighting where the market's "momentum" has officially turned.
/*-----------------------------+
|			       |
| Shared by www.Aptrafx.com    |
|			       |
+------------------------------*/

//+------------------------------------------------------------------+
//|                                                         NRTR.mq4 |
//|                                                                  |
//|                                        Ramdass - Conversion only |
//+------------------------------------------------------------------+

#property indicator_chart_window
#property indicator_buffers 2
#property indicator_color1 Aqua
#property indicator_color2 Violet
//---- input parameters
extern int AveragePeriod=10;
extern int CountBars=300;
//---- buffers
double value1[];
double value2[];
//+------------------------------------------------------------------+
//| Custom indicator initialization function                         |
//+------------------------------------------------------------------+
int init()
  {

//---- indicator line
   IndicatorBuffers(2);
   SetIndexStyle(0,DRAW_ARROW);
   SetIndexArrow(0,158);
   SetIndexStyle(1,DRAW_ARROW);
   SetIndexArrow(1,158);
   SetIndexBuffer(0,value1);
   SetIndexBuffer(1,value2);
//----
//----
   return(0);
  }
//+------------------------------------------------------------------+
//| NRTR                                                             |
//+------------------------------------------------------------------+
int start()
  {
   if (CountBars>Bars) CountBars=Bars;
   SetIndexDrawBegin(0,Bars-CountBars+1);
   SetIndexDrawBegin(1,Bars-CountBars+1);
   int i,counted_bars=IndicatorCounted();
   double value;
   double trend=0,dK,AvgRange,price;
//----
   if(Bars<=AveragePeriod) return(0);
//---- initial zero
   if(counted_bars<1)
   {
      for(i=1;i<=AveragePeriod;i++) value1[Bars-i]=0.0;
      for(i=1;i<=AveragePeriod;i++) value2[Bars-i]=0.0;
   }


AvgRange=0;
for (i=1 ; i<=AveragePeriod ; i++) AvgRange+= MathAbs(High[i]-Low[i]);
if (Symbol() == "USDJPY" || Symbol() == "GBPJPY" || Symbol() == "EURJPY")
{dK = (AvgRange/AveragePeriod)/100;}
else {dK = AvgRange/AveragePeriod;}

if (Close[CountBars-1] > Open[CountBars-1])
   {
   value1[CountBars - 1] = Close[CountBars - 1] * (1 - dK);
   trend = 1; value2[CountBars - 1] = 0.0;
   }
if (Close[CountBars-1] < Open[CountBars-1])  {
   value2[CountBars - 1] = Close[CountBars - 1] * (1 + dK);
   trend = -1; value1[CountBars - 1] = 0.0;
   }
//----
   i=CountBars-1;
   while(i>=0)
     {
value1[i]=0; value2[i]=0;
if (trend >= 0)
       {
       if (Close[i] > price) price = Close[i];
       value = price * (1 - dK);
       if (Close[i] < value)
          {
          price = Close[i];
          value = price * (1 + dK);
          trend = -1;
          }
       }
    else
       {
    if (trend <= 0)
       {
       if (Close[i] < price) price = Close[i];
       value = price * (1 + dK);
       if (Close[i] > value)
          {
          price = Close[i];
          value = price * (1 - dK);
          trend = 1;
          }
       }
       }
if (trend == 1)  {value1[i]=value; value2[i]=0.0;}
if (trend == -1)  {value2[i]=value; value1[i]=0.0;}

      i--;
     }
   return(0);
  }
Comments