NRTR_v1
Download script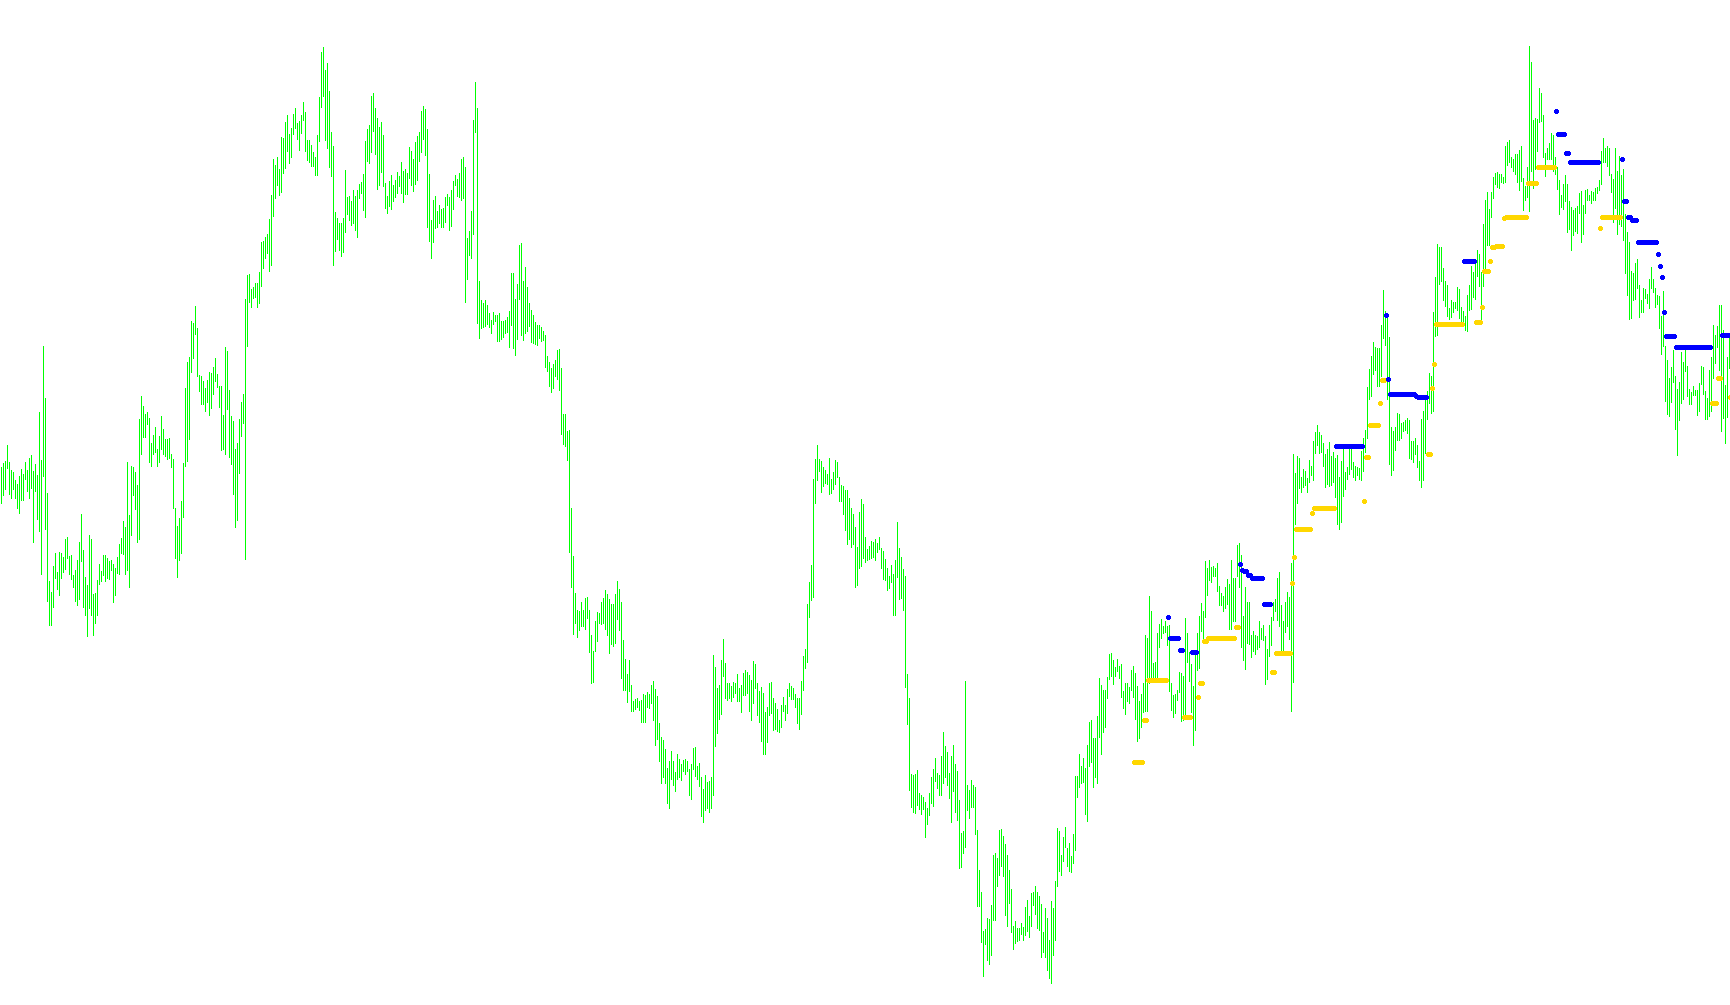
This technical indicator is designed to identify and visualize market trends by calculating the momentum of price movements relative to their recent volatility. Instead of simply following every small price fluctuation, the script filters out "market noise" to highlight the underlying direction of the currency or asset being traded.
How the Logic Works
1. Volatility Assessment The tool begins by analyzing a specific number of past candles (based on the user-defined period) to determine the average range between highs and lows. This calculation establishes a "buffer zone" or a sensitivity threshold. Interestingly, the script includes a specialized adjustment for specific Japanese Yen pairs (USDJPY, GBPJPY, EURJPY) to ensure the accuracy of these calculations remains consistent across different market types.
2. Trend Detection and State Management The logic operates by tracking whether the market is currently in an "Upward" or "Downward" state. It looks at the relationship between the opening and closing prices of candles to establish the initial direction.
- If the price moves significantly enough to break past a certain threshold based on the calculated volatility, the indicator registers a trend shift.
- It maintains a memory of the "peak" or "trough" price during these trends, ensuring that a minor retracement doesn't prematurely flip the trend signal unless it exceeds the established volatility limit.
3. Visual Representation The script translates these mathematical calculations into two distinct visual layers on your chart:
- Trend A (Aqua): Represents upward momentum. When the price is moving up and stays above the calculated threshold, this indicator remains active.
- Trend B (Violet): Represents downward momentum. When the price breaks below the threshold, the focus shifts to this layer.
Summary for Traders
In simple terms, this script acts as a "trend-following" filter. It calculates how much the market usually moves in a specific timeframe and only signals a trend change when the price makes a move significant enough to be considered a real shift rather than a minor fluctuation. By visualizing these two states clearly on your chart, it helps traders identify the dominant direction of the market while staying protected from getting caught in insignificant "whipsaws."
/*-----------------------------+
|			       |
| Shared by www.Aptrafx.com    |
|			       |
+------------------------------*/

//+------------------------------------------------------------------+
//|                                                         NRTR.mq4 |
//|                                                                  |
//|                                        Ramdass - Conversion only |
//+------------------------------------------------------------------+

#property indicator_chart_window
#property indicator_buffers 2
#property indicator_color1 Aqua
#property indicator_color2 Violet
//---- input parameters
extern int AveragePeriod=10;
extern int CountBars=300;
//---- buffers
double value1[];
double value2[];
//+------------------------------------------------------------------+
//| Custom indicator initialization function                         |
//+------------------------------------------------------------------+
int init()
  {

//---- indicator line
   IndicatorBuffers(2);
   SetIndexStyle(0,DRAW_ARROW);
   SetIndexArrow(0,159);
   SetIndexStyle(1,DRAW_ARROW);
   SetIndexArrow(1,159);
   SetIndexBuffer(0,value1);
   SetIndexBuffer(1,value2);
//----
//----
   return(0);
  }
//+------------------------------------------------------------------+
//| NRTR                                                             |
//+------------------------------------------------------------------+
int start()
  {
   if (CountBars>Bars) CountBars=Bars;
   SetIndexDrawBegin(0,Bars-CountBars+1);
   SetIndexDrawBegin(1,Bars-CountBars+1);
   int i,counted_bars=IndicatorCounted();
   double value;
   double trend=0,dK,AvgRange,price;
//----
   if(Bars<=AveragePeriod) return(0);
//---- initial zero
   if(counted_bars<1)
   {
      for(i=1;i<=AveragePeriod;i++) value1[Bars-i]=0.0;
      for(i=1;i<=AveragePeriod;i++) value2[Bars-i]=0.0;
   }


AvgRange=0;
for (i=1 ; i<=AveragePeriod ; i++) AvgRange+= MathAbs(High[i]-Low[i]);
if (Symbol() == "USDJPY" || Symbol() == "GBPJPY" || Symbol() == "EURJPY")
{dK = (AvgRange/AveragePeriod)/100;}
else {dK = AvgRange/AveragePeriod;}

if (Close[CountBars-1] > Open[CountBars-1])
   {
   value1[CountBars - 1] = Close[CountBars - 1] * (1 - dK);
   trend = 1; value2[CountBars - 1] = 0.0;
   }
if (Close[CountBars-1] < Open[CountBars-1])  {
   value2[CountBars - 1] = Close[CountBars - 1] * (1 + dK);
   trend = -1; value1[CountBars - 1] = 0.0;
   }
//----
   i=CountBars-1;
   while(i>=0)
     {
value1[i]=0; value2[i]=0;
if (trend >= 0)
       {
       if (Close[i] > price) price = Close[i];
       value = price * (1 - dK);
       if (Close[i] < value)
          {
          price = Close[i];
          value = price * (1 + dK);
          trend = -1;
          }
       }
    else
       {
    if (trend <= 0)
       {
       if (Close[i] < price) price = Close[i];
       value = price * (1 + dK);
       if (Close[i] > value)
          {
          price = Close[i];
          value = price * (1 - dK);
          trend = 1;
          }
       }
       }
if (trend == 1)  {value1[i]=value; value2[i]=0.0;}
if (trend == -1)  {value2[i]=value; value1[i]=0.0;}

      i--;
     }
   return(0);
  }
//+------------------------------------------------------------------+
Comments