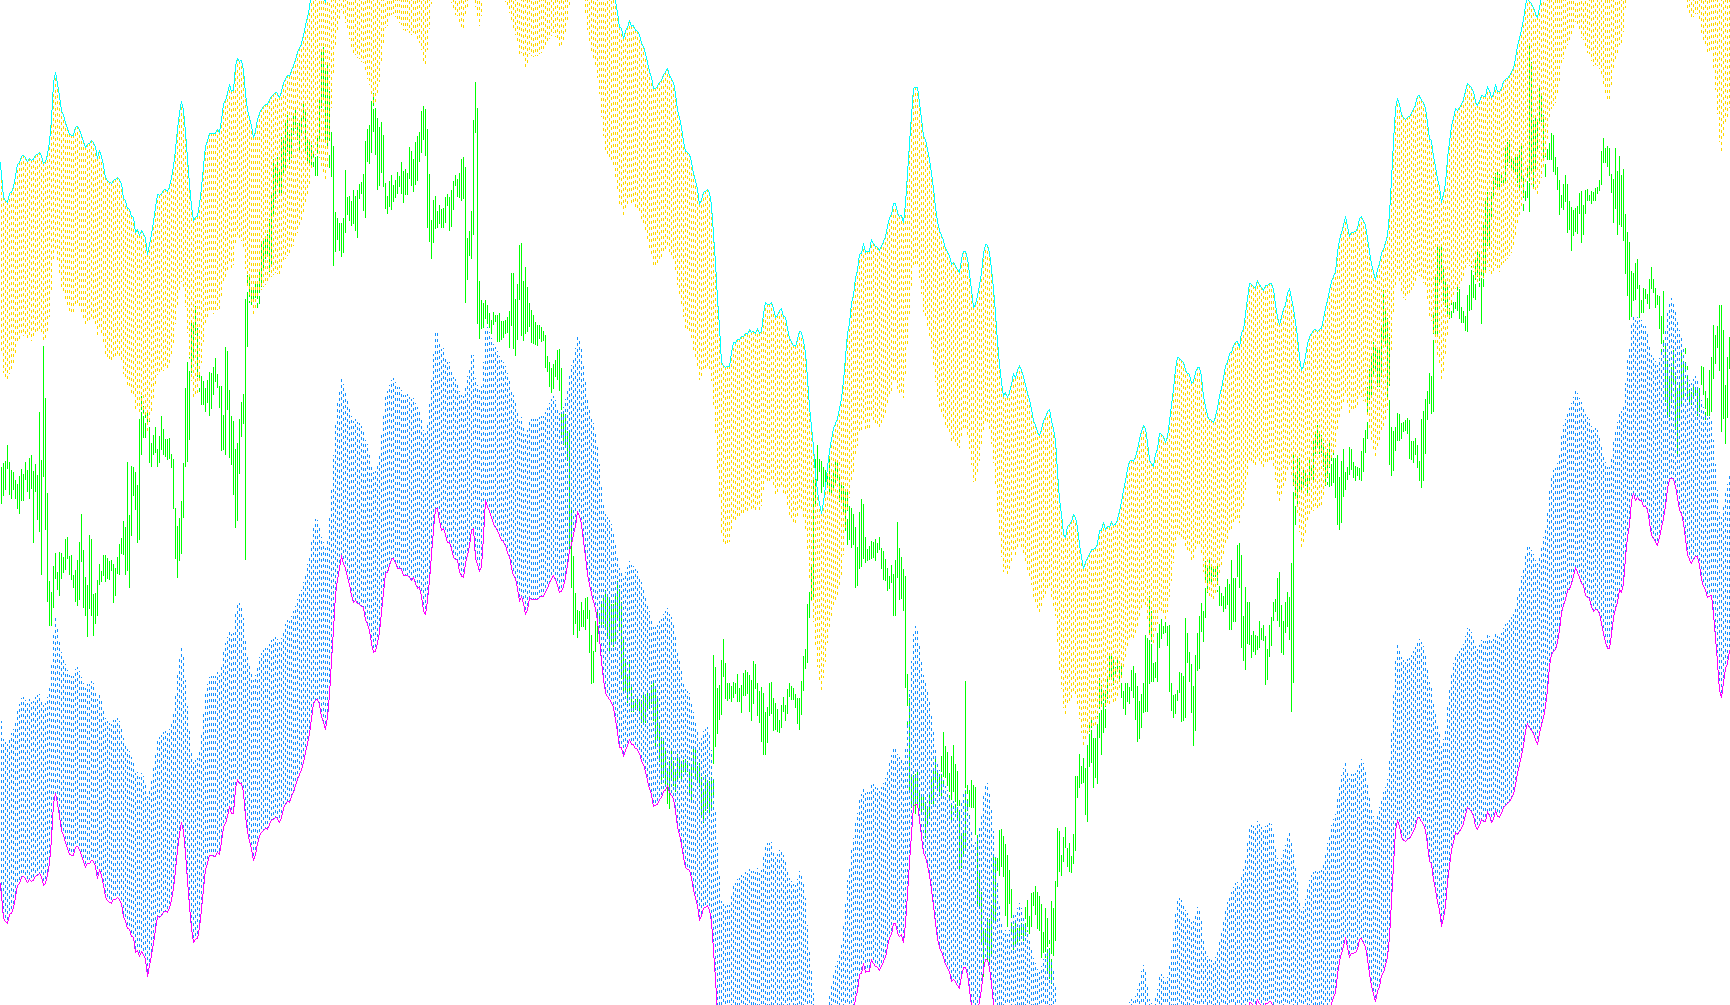
This technical tool is designed to provide visual traders with a sophisticated way to view market momentum and price trends simultaneously. By blending traditional moving averages with momentum oscillators, it creates a multi-layered "map" of the price action directly on your main chart.
Core Logic Overview
The script operates by analyzing two primary types of market data: Price Averages and Relative Strength (Momentum). Instead of just showing you a single line, it calculates four different variations of the market's path based on how "overbought" or "oversold" the market is currently behaving.
How It Works
-
The Foundation (Moving Average): The script starts by calculating a Smoothed Moving Average (SMMA). This represents the underlying "heartbeat" of the price—the general direction in which the market is moving regardless of small, temporary spikes.
-
The Momentum Modifier (RSI): To add depth, the script looks at the Relative Strength Index (RSI). It doesn't just look at one point in time; it takes an average of several recent RSI readings to ensure the data is stable and not reacting to "noise."
-
The Dynamic Calculation: This is where the unique logic happens. The script takes that base Moving Average and adjusts it mathematically based on the RSI values. It looks for specific thresholds (upper and lower limits) to determine how much "stretch" there is in the current price movement.
Visual Representation
Instead of giving you a single output, the tool generates four distinct data sets:
- Primary Overbought/Oversold Layers: These identify extreme conditions where the market may be reaching its limits.
- Secondary Buffer Layers: These provide "intermediate" zones, helping traders see not just the extremes, but also the transitional phases of a trend.
The script automatically adjusts its sensitivity based on your chosen timeframe (such as 1-minute or 5-minute charts). This ensures that the visual "stretch" of the lines remains proportionate whether you are day trading very fast movements or watching longer-term trends.
Summary for the Trader
Think of this tool as a "weighted" moving average map. While a standard moving average tells you where the price was, this script attempts to show you where the price is likely heading by weighing that history against the current speed and strength (momentum) of the market. It helps filter out visual clutter by providing a multi-layered view of potential support and resistance zones based on mathematical pressure.
#property copyright "Copyright ?2007, okwh."
#property link "http://blog.sina.com.cn/FXTrade"
//#property  indicator_separate_window
#property indicator_chart_window
#property indicator_buffers 8
#property indicator_color1 Tan//Red
#property indicator_color2 Tan
#property indicator_color3 Red
#property indicator_color4 Red
#property indicator_color5 DarkSlateGray//SkyBlue//Red
#property indicator_color6 DarkSlateGray//SkyBlue
#property indicator_color7 DarkSlateGray//DarkOliveGreen//Red
#property indicator_color8 DarkSlateGray//DarkOliveGreen//Tan//SkyBlue
//---- input parameters
extern int       rsiP = 34;//23;
extern int       EMAp = 7;//55;3 5 7 9 13
extern int       up = 70;//9;
extern int       dn = 30;//9;
extern int       nup = 60;//9;
extern int       ndn = 40;//9;
extern int       rsiC = 5;//9;3  7 13 19
double ratio = 0.0005;
//---- buffers
double ExtMapBuffer1[];
double ExtMapBuffer2[];
double ExtMapBuffer3[];
double ExtMapBuffer4[];
double ExtMapBuffer5[];
double ExtMapBuffer6[];
double ExtMapBuffer7[];
double ExtMapBuffer8[];
//+------------------------------------------------------------------+
//| Custom indicator initialization function                         |
//+------------------------------------------------------------------+
int init()
  {
//---- indicators
SetLevelValue(0,0.0);


   IndicatorBuffers(8);
   SetIndexStyle(0,DRAW_HISTOGRAM,2, 1);
   SetIndexBuffer(0,ExtMapBuffer1);
   SetIndexStyle(1,DRAW_HISTOGRAM,2, 1);
   SetIndexBuffer(1,ExtMapBuffer3);
   SetIndexStyle(2,DRAW_HISTOGRAM,2, 1);
   SetIndexStyle(3,DRAW_HISTOGRAM,2, 1);
   SetIndexBuffer(2,ExtMapBuffer2);
   SetIndexBuffer(3,ExtMapBuffer4);
    SetIndexStyle(4,DRAW_LINE);
    SetIndexStyle(5,DRAW_LINE);
    SetIndexStyle(6,DRAW_LINE);
    SetIndexStyle(7,DRAW_LINE);
   SetIndexBuffer(4,ExtMapBuffer5);
   SetIndexBuffer(5,ExtMapBuffer6);
   SetIndexBuffer(6,ExtMapBuffer7);
   SetIndexBuffer(7,ExtMapBuffer8);
   ratio = 0.0004;
   if (Period()==PERIOD_M5) ratio = 0.0002;
   if (Period()==PERIOD_M1) ratio = 0.0001;
//----
   return(0);
  }
//+------------------------------------------------------------------+
//| Custom indicator deinitialization function                       |
//+------------------------------------------------------------------+
int deinit()
  {
//----

//----
   return(0);
  }
//+------------------------------------------------------------------+
//| Custom indicator iteration function                              |
//+------------------------------------------------------------------+
int start()
  {
   int  j,  counted_bars=IndicatorCounted();
//----A := N -( N * ( X - Y ) / 100 ),
double rsi =0,ma;
for (int i= Bars-counted_bars-1;i>=0;i--)
{
   rsi = iRSI(NULL,0,rsiP,PRICE_CLOSE,i)/rsiC;
   for (j=1; j<rsiC; j++)
    rsi += iRSI(NULL,0,rsiP,PRICE_CLOSE,i+j)/rsiC;

/*ExtMapBuffer1[i]= Close[i]*(1-(rsi-up)*ratio);
ExtMapBuffer3[i]= Close[i]*(1-(rsi-nup)*ratio);
ExtMapBuffer2[i]= Close[i]*(1-(rsi-dn)*ratio);
ExtMapBuffer4[i]= Close[i]*(1-(rsi-ndn)*ratio);
*/
ma = iMA(NULL,0,EMAp,0,MODE_SMMA,PRICE_CLOSE,i);
ExtMapBuffer1[i]= ma*(1-(rsi-up)*ratio);
ExtMapBuffer3[i]= ma*(1-(rsi-nup)*ratio);
ExtMapBuffer2[i]= ma*(1-(rsi-dn)*ratio);
ExtMapBuffer4[i]= ma*(1-(rsi-ndn)*ratio);

ExtMapBuffer5[i]=ExtMapBuffer1[i];
ExtMapBuffer6[i]=ExtMapBuffer2[i];
ExtMapBuffer7[i]=ExtMapBuffer3[i];
ExtMapBuffer8[i]=ExtMapBuffer4[i];
}

//----
   return(0);
  }
//+------------------------------------------------------------------+
Comments