OsMA_v2
Download script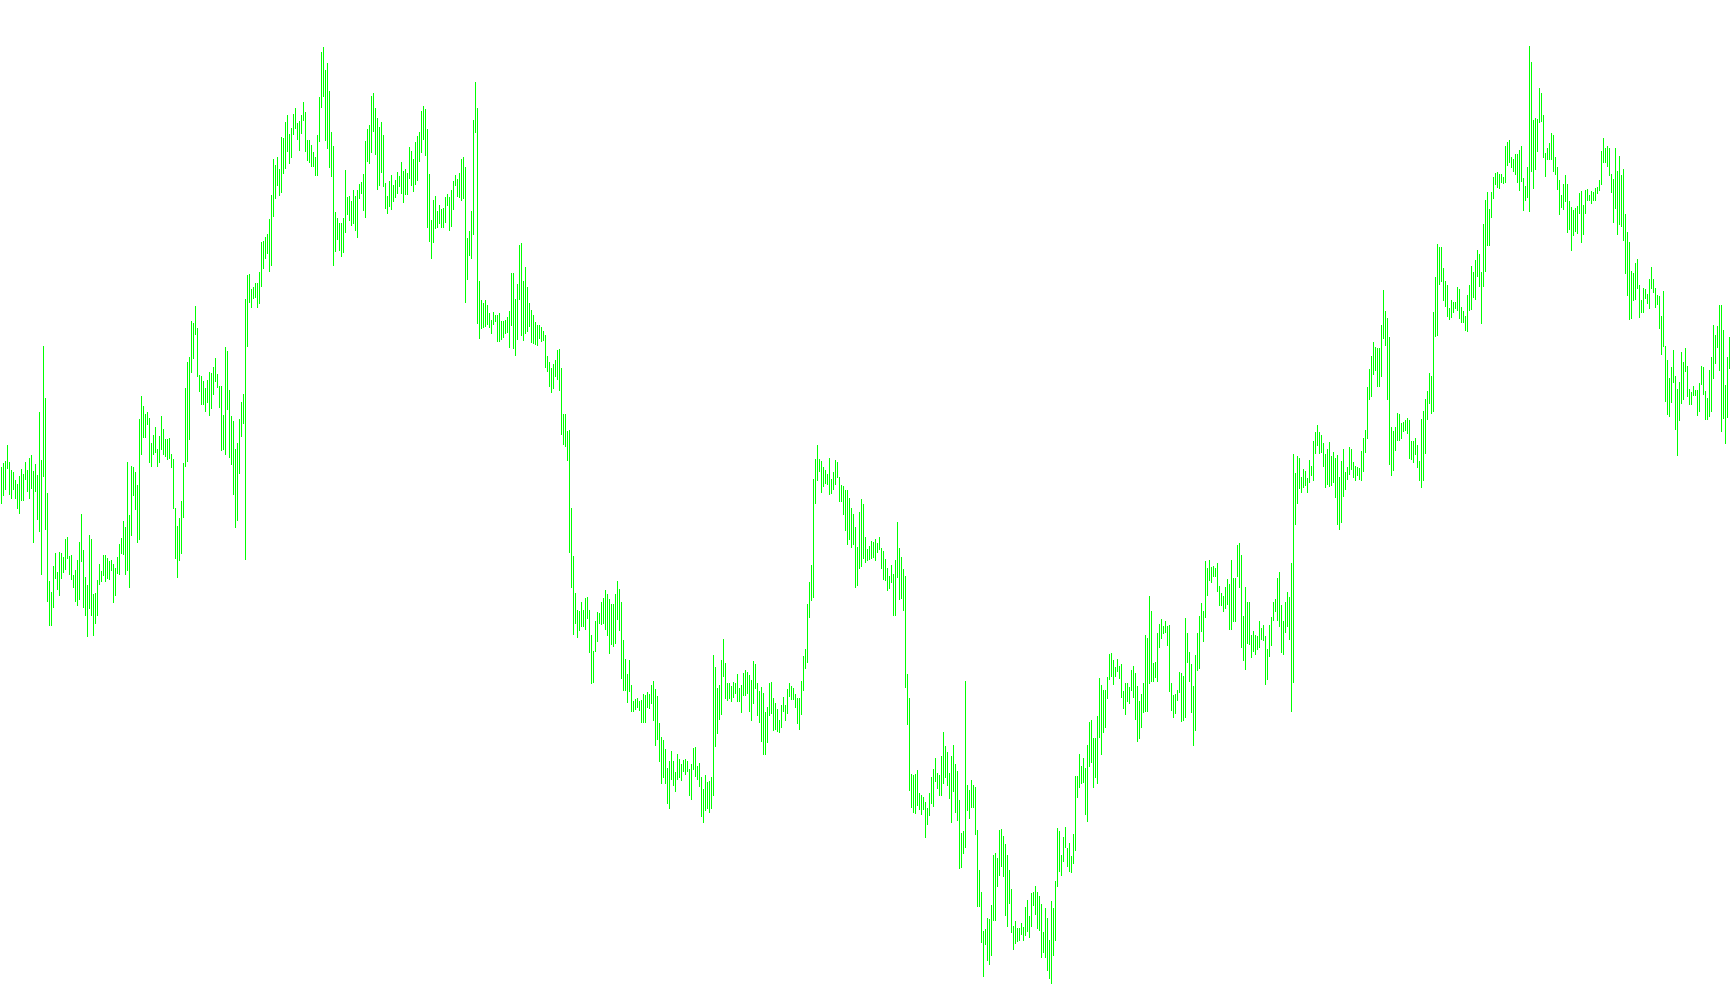
Technical Overview: OsMA Indicator Logic
This script functions as a customized technical analysis tool designed to help traders visualize momentum and price trends. Rather than showing you raw price movements, it processes data into a "histogram" format that highlights the relationship between different moving averages.
How the Logic Works
The indicator operates through a three-step calculation process to filter out market "noise" and identify underlying trends:
-
Calculating the Momentum Gap: The script begins by comparing two different types of "Exponential Moving Averages" (EMAs). One is set to a faster speed (the Fast EMA) and one to a slower speed (the Slow EMA). By subtracting the slow average from the fast average, the tool identifies the current momentum. When the fast average is significantly higher than the slow one, it suggests upward pressure; when it is lower, it suggests downward pressure.
-
Creating the Signal Line: Instead of looking at the raw difference calculated in the first step, the script takes that data and applies a "Simple Moving Average" (SMA) to it. This creates a "Signal Line." Think of this as a smoothed-out version of the momentum. It helps traders see the general direction of the trend without being distracted by minor, temporary price fluctuations.
-
The Final Histogram Output: The final visual result you see on your chart is the difference between the Momentum Gap and the Signal Line.
Practical Interpretation
The resulting histogram represents the "velocity" of the market. By observing how these bars move above or below the zero line, users can identify:
- Trend Strength: How far the histogram deviates from the center indicates how强势 (strong) the current movement is.
- Trend Reversals: When the histogram crosses the zero line or changes direction significantly, it can alert a trader that the momentum is shifting from bullish to bearish, or vice versa.
Essentially, this tool acts as a filter, converting complex price history into a simplified visual map of market energy and direction.
/*-----------------------------+
|			       |
| Shared by www.Aptrafx.com    |
|			       |
+------------------------------*/

//+------------------------------------------------------------------+
//|                                                         OsMA.mq4 |
//|                      Copyright © 2004, MetaQuotes Software Corp. |
//|                                       http://www.metaquotes.net/ |
//+------------------------------------------------------------------+
#property  copyright "Copyright © 2004, MetaQuotes Software Corp."
#property  link      "http://www.metaquotes.net/"
//---- indicator settings
#property  indicator_separate_window
#property  indicator_buffers 1
#property  indicator_color1  Silver
//---- indicator parameters
extern int FastEMA=12;
extern int SlowEMA=26;
extern int SignalSMA=9;
//---- indicator buffers
double     ind_buffer1[];
double     ind_buffer2[];
double     ind_buffer3[];

//+------------------------------------------------------------------+
//| Custom indicator initialization function                         |
//+------------------------------------------------------------------+
int init()
  {
//---- 2 additional buffers are used for counting.
   IndicatorBuffers(3);
//---- drawing settings
   SetIndexStyle(0,DRAW_HISTOGRAM,STYLE_SOLID,3);
   SetIndexDrawBegin(0,SignalSMA);
   IndicatorDigits(MarketInfo(Symbol(),MODE_DIGITS)+2);
//---- 3 indicator buffers mapping
   if(!SetIndexBuffer(0,ind_buffer1) &&
      !SetIndexBuffer(1,ind_buffer2) &&
      !SetIndexBuffer(2,ind_buffer3))
      Print("cannot set indicator buffers!");
//---- name for DataWindow and indicator subwindow label
   IndicatorShortName("OsMA("+FastEMA+","+SlowEMA+","+SignalSMA+")");
//---- initialization done
   return(0);
  }
//+------------------------------------------------------------------+
//| Moving Average of Oscillator                                     |
//+------------------------------------------------------------------+
int start()
  {
   int limit;
   int counted_bars=IndicatorCounted();
//---- check for possible errors
   if(counted_bars<0) return(-1);
//---- last counted bar will be recounted
   if(counted_bars>0) counted_bars--;
   limit=Bars-counted_bars;
//---- macd counted in the 1-st additional buffer
   for(int i=0; i<limit; i++)
      ind_buffer2[i]=iMA(NULL,0,FastEMA,0,MODE_EMA,PRICE_CLOSE,i)-iMA(NULL,0,SlowEMA,0,MODE_EMA,PRICE_CLOSE,i);
//---- signal line counted in the 2-nd additional buffer
   for(i=0; i<limit; i++)
      ind_buffer3[i]=iMAOnArray(ind_buffer2,Bars,SignalSMA,0,MODE_SMA,i);
//---- main loop
   for(i=0; i<limit; i++)
      ind_buffer1[i]=ind_buffer2[i]-ind_buffer3[i];
//---- done
   return(0);
  }
//+------------------------------------------------------------------+
Comments