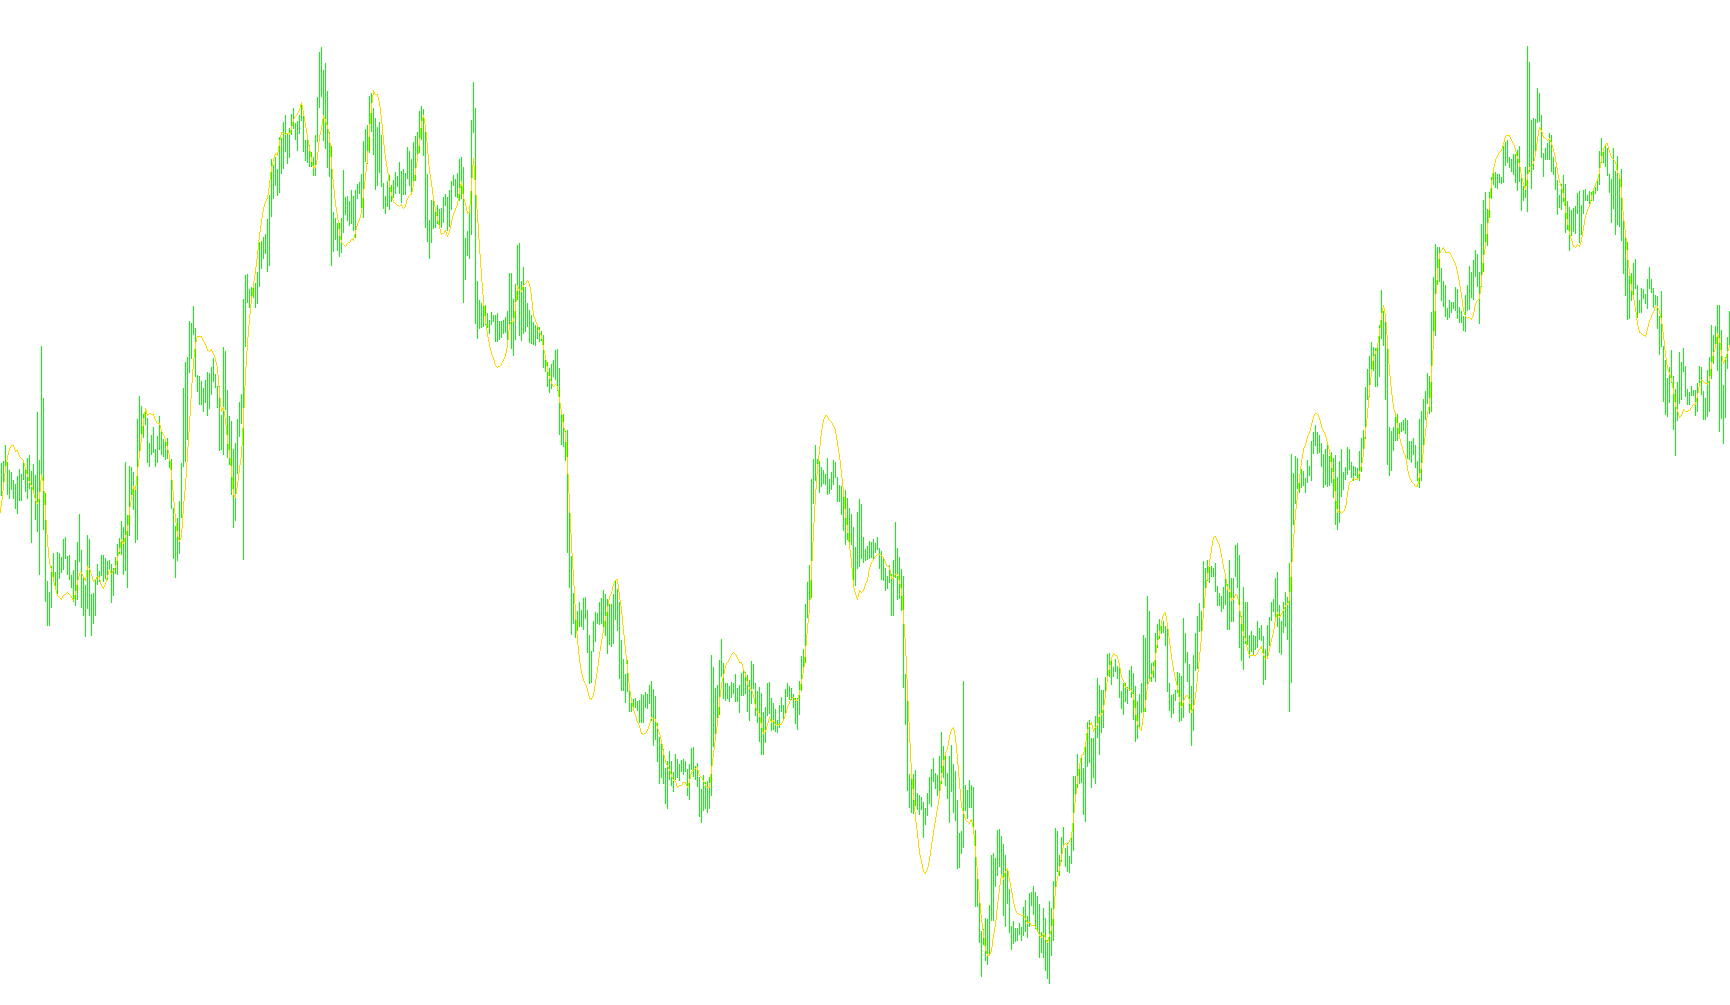
This tool is designed to provide a sophisticated visual analysis of price trends by utilizing parabolic regression and volatility boundaries. Unlike standard moving averages that simply track the average price over a set timeframe, this script uses more advanced mathematical modeling to project the "curvature" of market movements.
Core Methodology: Parabolic Approximation
The primary logic of the script is based on a Parabolic Moving Average. Instead of looking at the market as a series of random points, the tool treats price action as a curve.
To achieve this, it performs a regression analysis on historical data. It calculates three specific coefficients that allow it to map out a parabola (a U-shaped or inverted U-shaped curve) that best fits the recent price history. By determining the "bend" of this curve, the indicator can identify the underlying momentum more smoothly than a standard linear average. This helps traders see where the price is naturally heading based on its current trajectory.
Optional Volatility Bands
The script includes an optional feature that adds Bollinger-style bands to the parabolic line. When enabled, the logic follows these steps:
- Standard Deviation Calculation: The tool measures how much the price "wiggles" or deviates from the average trend over a specific period.
- Volatility Boundaries: It establishes an upper and lower boundary based on this deviation.
- Visual Context: These bands represent the "normal" range of market noise. When price stays within these bands, it is considered standard behavior; when it pushes toward or through them, it may indicate significant volatility or a potential trend exhaustion point.
Key User Options
- Period: This determines the look-back window. A larger number considers more history to create a smoother curve, while a smaller number reacts more quickly to sudden price changes.
- Bands Enabled: A simple toggle to switch between seeing just the central trend line or the full visual suite including the upper and lower volatility boundaries.
- Deviation (BandsDev): This allows the user to adjust the width of the bands. A higher value creates wider "safety zones," while a lower value tightens the bands around the parabolic trend.
Summary for Traders
Essentially, this script acts as a "trend mapper." The central line tells you the smoothed path of the price based on its current curve, and the optional bands tell you how much room that price has to move before it is considered an outlier. It is built to filter out minor market noise while highlighting the broader geometric direction of the price movement.
//+------------------------------------------------------------------+
//|                                                     ParMA_BB.mq4 |
//|                      Copyright © 2006, MetaQuotes Software Corp. |
//|                                        http://www.metaquotes.net |
//+------------------------------------------------------------------+
#property copyright "Copyright © 2006, MetaQuotes Software Corp."
#property link      "http://www.metaquotes.net"

#property indicator_chart_window
#property indicator_buffers 3
#property indicator_color1 BlueViolet // main line
#property indicator_color2 DodgerBlue // upper band
#property indicator_color3 DodgerBlue // lower band
//---- input parameters
extern int ParMA_Period  = 30;
extern bool BandsEnabled = false;
extern double BandsDev   = 1.0;
//---- buffers
double ParMABuffer[];
double UpperBandBuffer[];
double LowerBandBuffer[];
//+------------------------------------------------------------------+
//| Custom indicator initialization function                         |
//+------------------------------------------------------------------+
int init()
 {
  if (ParMA_Period <= 1) // fool-proof & to prevent zero divide error
   { ParMA_Period = 3; }
 //---- indicators
  IndicatorDigits(Digits);
  //
  SetIndexStyle(0, DRAW_LINE);
  SetIndexBuffer(0, ParMABuffer);
  SetIndexLabel(0, "ParMA Line");
  SetIndexDrawBegin(0, ParMA_Period);
  //
  if (BandsEnabled == true) // initialize Bollinger Bands buffers, if allowed
  {
   SetIndexStyle(1, DRAW_LINE);
   SetIndexBuffer(1, UpperBandBuffer);
   SetIndexLabel(1, "ParMA Upper Band");
   SetIndexDrawBegin(1, ParMA_Period);
   //
   SetIndexStyle(2, DRAW_LINE);
   SetIndexBuffer(2, LowerBandBuffer);
   SetIndexLabel(2, "ParMA Lower Band");
   SetIndexDrawBegin(2, ParMA_Period);
  }
 //----
  return(0);
 }
//+------------------------------------------------------------------+
//| Custom indicator deinitialization function                       |
//+------------------------------------------------------------------+
int deinit()
 {
 //----
  Comment(""); // remove comment when finished; see notes below
 //----
  return(0);
 }
//+------------------------------------------------------------------+
//| Custom indicator iteration function                              |
//+------------------------------------------------------------------+
int start()
 {
  int counted_bars = IndicatorCounted();
  int Limit, cnt, i, k;
  double old_val, new_val, sum, std_dev;
 //----
  if (counted_bars < 0) { return(-1); } // to prevent possible erors
  Limit = Bars - counted_bars;
  //
  if (Limit > ParMA_Period) // run once when getting started
   { cnt = Limit - ParMA_Period; }
  else                     // run elsewhere
   { cnt = Limit; }
  // calculate ParMA - one step on time-serie bars array
  for (i=cnt; i>=0; i--)
   { ParMABuffer[i] = GetParMA(i, ParMA_Period); }
    //
  if (BandsEnabled == true) // draw Bollinger Bands, if allowed
   {
    // calculate standard deviation
    i = Bars - ParMA_Period;
    if (counted_bars > (ParMA_Period - 1))
     { i = Bars - counted_bars - 1; }
    while (i >= 0)
     {
      sum = 0.0;
      k = i + ParMA_Period - 1;
      old_val = ParMABuffer[i];
      while (k >= i)
       {
        new_val = Close[k] - old_val;
        sum += new_val * new_val;
        k--;
       }
      std_dev = MathSqrt(sum / ParMA_Period);
      // complete BB's buffers
      UpperBandBuffer[i] = old_val + BandsDev * std_dev;
      LowerBandBuffer[i] = old_val - BandsDev * std_dev;
      i--;
     }
    // optional - may be deleted without hesitations
    // if you did it, remove 'Comment("");' from deinit() procedure too

   }
  // optional - may be deleted without hesitations
  // if you did it, remove 'Comment("");' from deinit() procedure too
  if (BandsEnabled != true)

 //----
  return(0);
 }
//+------------------------------------------------------------------+
/*
 Parabolic approximation: y(x) = b0 + b1 * x + b2 * x^2;
 To obtain coefficients b0, b1, b2 we have to solve a linear system:
 b0 * N          + b1 * Sum(x,N)   + b2 * Sum(x^2,N) = Sum(y,N);
 b0 * Sum(x,N)   + b1 * Sum(x^2,N) + b2 * Sum(x^3,N) = Sum((x*y),N);
 b0 * Sum(x^2,N) + b1 * Sum(x^3,N) + b2 * Sum(x^4,N) = Sum(((x^2)*y),N);
 that can easily be done explicitly by hands.
*/
//+------------------------------------------------------------------+
double GetParMA(int shift, int ma_period)
 {
  static int ro_cnt = 1; // run-once counter
  static double sum_x = 0.0, sum_x2 = 0.0, sum_x3 = 0.0, sum_x4 = 0.0;
  int i, loop_begin; // counters
  double sum_y, sum_xy, sum_x2y, var_tmp;
  double A, B, C, D, E, F, K, L, M, P, Q, R, S; // intermediates
  double B0, B1, B2; // parabolic regression coefficients
  double ret_val;    // value to be returned - parabolic MA
 //----
  // initial accumulation - run once when getting started
  while (ro_cnt <= ma_period)
   {
    var_tmp  = ro_cnt;
    sum_x   += var_tmp; // sum(x)
    var_tmp *= ro_cnt;
    sum_x2  += var_tmp; // sum(x^2)
    var_tmp *= ro_cnt;
    sum_x3  += var_tmp; // sum(x^3)
    var_tmp *= ro_cnt;
    sum_x4  += var_tmp; // sum(x^4)
    ro_cnt++;
   }
  // main calculation loop
  loop_begin = shift + ma_period - 1;
  sum_y   = 0.0;
  sum_xy  = 0.0;
  sum_x2y = 0.0;
  for (i = 1; i<=ma_period; i++)
   {
    var_tmp  = Close[loop_begin-i+1];
    sum_y   += var_tmp;
    sum_xy  += i * var_tmp;     // sum(x*y)
    sum_x2y += i * i * var_tmp; // sum((x^2)*y)
   }
  // initialization
  A = ma_period;
  B = sum_x; C = sum_x2; F = sum_x3;
  M = sum_x4; P = sum_y; R = sum_xy; S = sum_x2y;
  // intermediates
  D = B; E = C; K = C; L = F;
  Q = D / A; E = E - Q * B; F = F - Q * C;
  R = R - Q * P; Q = K / A; L = L - Q * B;
  M = M - Q * C; S = S - Q * P; Q = L / E;
  // calculate regression coefficients
  B2 = (S - R * Q) / (M - F * Q);
  B1 = (R - F * B2) / E;
  B0 = (P - B * B1 - C * B2) / A;
  // value to be returned - parabolic MA
  ret_val = B0 + (B1 + B2 * A) * A;
 //----
  return(ret_val);
 }
//+------------------------------------------------------------------+
Comments