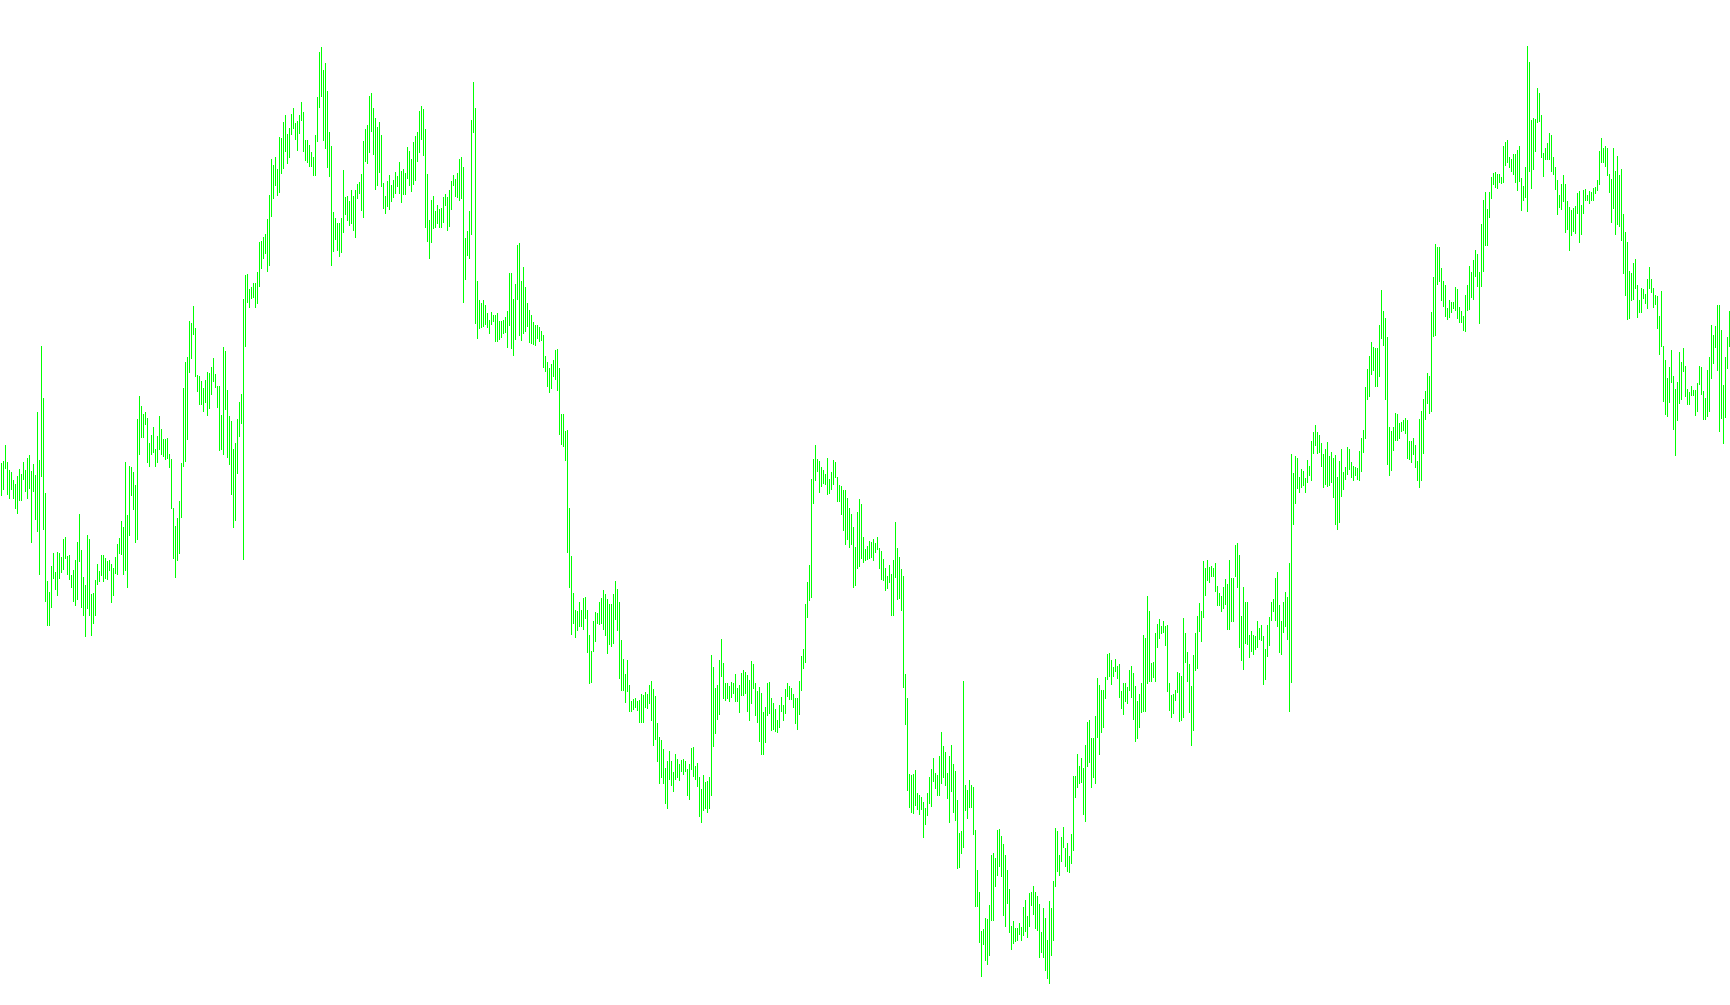
This script is designed as a specialized financial analysis tool for the MetaTrader platform. Its primary purpose is to measure and visualize the statistical relationship between two different currency pairs (for example, comparing how EURUSD moves in relation to GBPUSD).
Instead of simply looking at individual price charts, this indicator calculates a specific correlation metric known as the Pearson Correlation Coefficient. Here is a breakdown of how the logic works in plain terms:
Core Functionality
The tool analyzes historical price data for two separate assets simultaneously. It looks back over a specific number of past bars (the "history") to determine if the two assets are moving in the same direction, opposite directions, or if their movements are unrelated.
How the Calculation Works
To produce its results, the script follows these logical steps:
- Trend Smoothing: The script first calculates a Simple Moving Average for both currency pairs. This helps "smooth out" minor price flickers and focuses on the broader trend of each asset rather than individual erratic movements.
- Price Deviation Analysis: It measures how much the actual closing price of each currency deviates from its respective moving average. By doing this, the script can see if one currency is "overperforming" or "underperforming" its recent average compared to the other.
- Statistical Correlation: The logic then multiplies these deviations against each other over a defined period. This mathematical process determines the strength of the connection:
- A high positive value suggests that when one currency goes up, the other tends to go up as well.
- A negative value suggests they move in opposite directions.
- A value near zero indicates that there is little to no statistical relationship between their movements.
- Standardization: Finally, the script scales this data using "Standard Deviation." This ensures that the final result is a normalized figure, making it much easier for a trader to read and interpret regardless of how volatile the individual currencies are.
Visual Output
The final result is displayed in a separate window at the bottom of your trading platform. It provides a continuous line showing how the correlation between these two specific assets has evolved over time, allowing you to identify periods where the historical relationship between the currencies is strengthening or breaking down.
//+------------------------------------------------------------------+
//|                                                     #DT-Pirsonq4 |
//|                                           Copyright © 2007, klot |
//|                                                     klot@mail.ru |
//+------------------------------------------------------------------+
#property copyright "Copyright © 2007, klot"
#property link      "klot@mail.ru"

#property indicator_separate_window
#property indicator_buffers 1
#property indicator_color1 Aqua
#property indicator_level1 0.0
extern string symb0="EURUSD";
extern string symb1="GBPUSD";
//extern int Period1=PERIOD_H4;
extern    int N=20;
extern    int NrBars=500;
//---- indicator buffers
double Pirson[];
int per0;
int per1;

//+------------------------------------------------------------------+
//| Custom indicator initialization function                         |
//+------------------------------------------------------------------+
int init()
  {

//---- indicators
   SetIndexStyle(0,DRAW_SECTION);
//---- indicator buffers mapping
   SetIndexBuffer(0,Pirson);
   SetIndexEmptyValue(0,0.0);
//----
   return(0);
  }
//+------------------------------------------------------------------+
//| Custom indicator deinitialization function                       |
//+------------------------------------------------------------------+
int deinit()
  {
//----

//----
   return(0);
  }
//+------------------------------------------------------------------+
//| Custom indicator iteration function                              |
//+------------------------------------------------------------------+
int start()
  {
   int    counted_bars=IndicatorCounted();
//----
   double X,Y,Sx,Sy;
   double sum=0.0;
  per0=Period();
  per1=Period();
   //----
   for( int shift=NrBars-N-1; shift>=0; shift--) {

      X=iMA(symb0,per0,N,0,MODE_SMA,PRICE_CLOSE,shift);
      Y=iMA(symb1,per1,N,0,MODE_SMA,PRICE_CLOSE,shift);
      //----
      sum=0;
      for( int i=N-1; i>=0; i--) {
         sum+=(iClose(symb0,per0,shift+i)-X)*(iClose(symb1,per1,shift+i)-Y);
      }
      //---
      Sx=iStdDev(symb0,per0,N,0,MODE_SMA,PRICE_CLOSE,shift);
      Sy=iStdDev(symb1,per1,N,0,MODE_SMA,PRICE_CLOSE,shift);
      //---
      Pirson[shift]=sum/((N-1)*Sx*Sy);
    }
//----
   return(0);
  }
//+------------------------------------------------------------------+
Comments