--PivotCustomTime----_001
Download script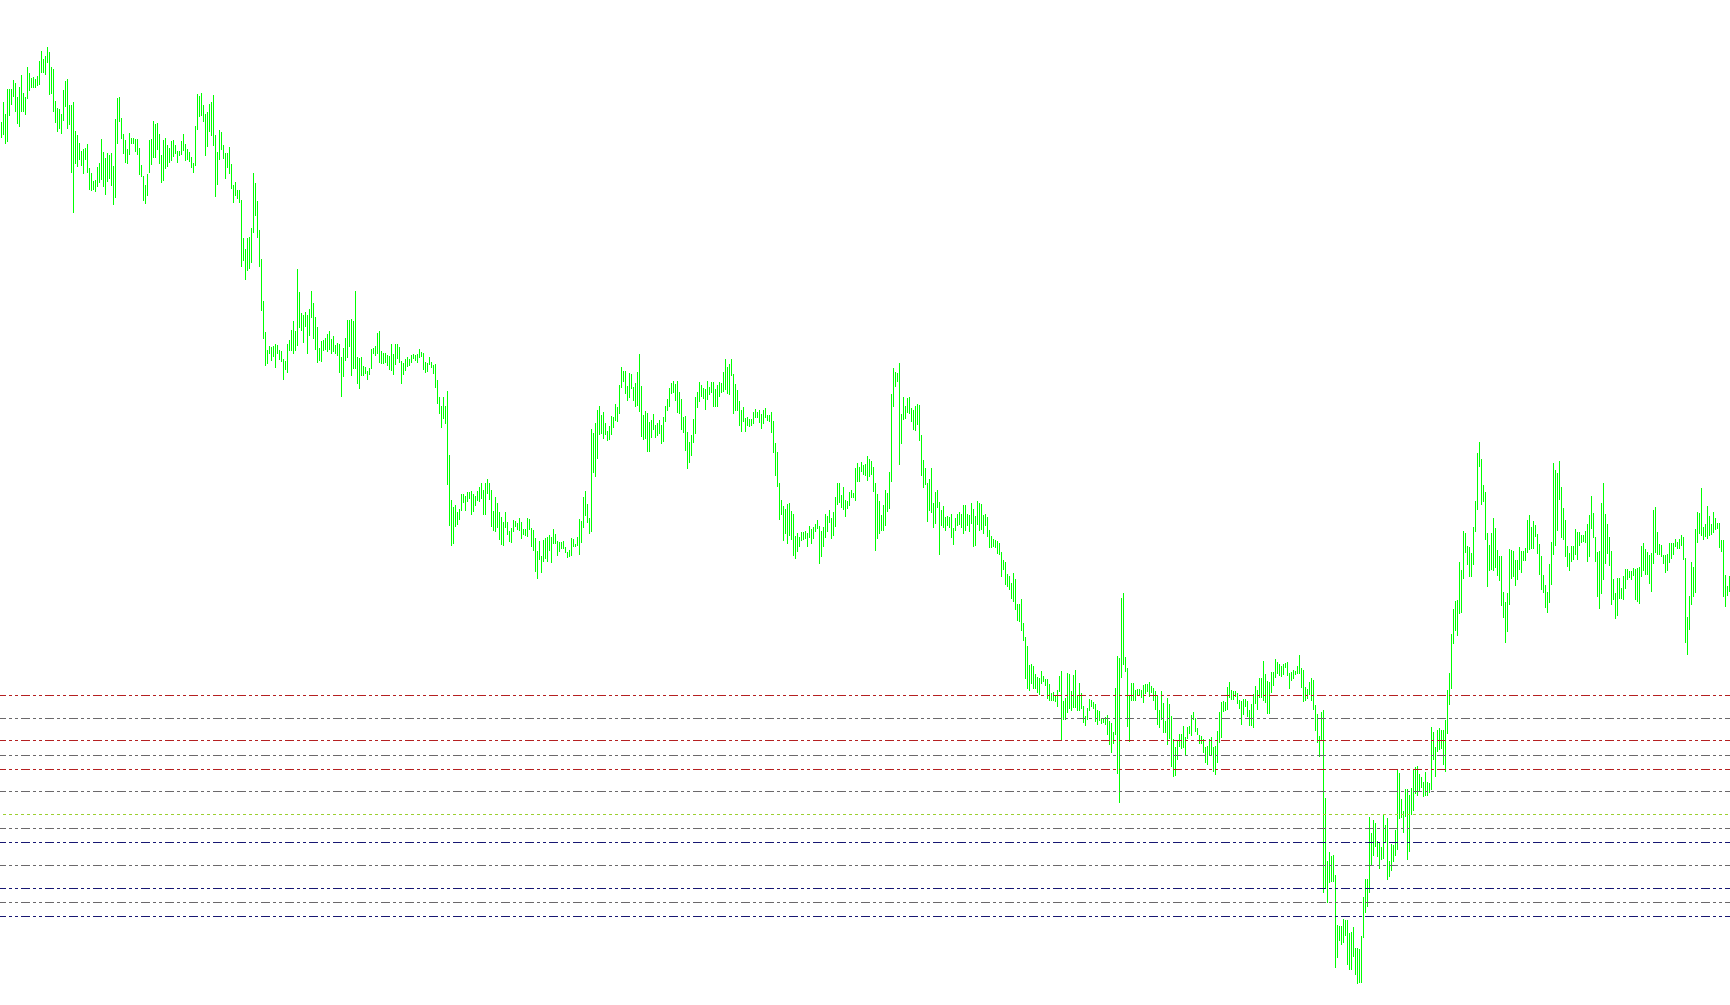
This script is a specialized technical analysis tool designed for the MetaTrader 4 platform. Its primary purpose is to automatically identify and visualize specific price levels—known as "Pivots"—directly on your trading chart. These levels are used by traders to identify potential areas of support (where price might stop falling) and resistance (where price might stop rising).
Core Functionality
The script automates the calculation of several different types of price markers based on historical market data. Rather than requiring you to calculate these numbers manually, the tool looks at previous price action (such as the highs, lows, and closing prices of previous periods) and draws horizontal lines and text labels on your screen in real-time.
Key Features and Logic
1. Pivot Point Calculations The script primarily focuses on standard Pivot Points. It calculates a central "Pivot" value based on the average of the previous period's high, low, and closing prices. From that center point, it derives:
- Resistance Levels (R1, R2, R3): Potential ceiling prices where selling pressure may increase.
- Support Levels (S1, S2, S3): Potential floor prices where buying interest may emerge.
2. Camarilla Rotation The script includes an optional "Camarilla" logic. This is a different mathematical approach to identifying price levels, often used by day traders to find specific breakdown or breakout points. If enabled, the script will display distinct H (High) and L (Low) markers.
3. Midpoint Pivot Points The tool can also calculate "Midpoints." These are intermediate levels that sit between the primary Support and Resistance lines. They provide a more granular view of the market, allowing traders to see smaller price "zones" within the larger trading range.
4. Dynamic Timeframes You can configure the script to look at different time horizons. While it defaults to daily data, it is built to handle various periods (such as hourly, 4-hour, or even weekly intervals), allowing you to switch between short-term scalping levels and long-term trend levels easily.
5. Visual Interface The script handles all the "heavy lifting" of drawing on your chart:
- Automated Labeling: It places text labels (like "R1", "S2", etc.) so you can immediately identify what each line represents.
- Visual Styling: It distinguishes different types of lines using unique colors and styles (e.g., dashed lines for support/resistance vs. solid dots for the main pivot).
- Live Updates: The script constantly monitors the market; as new price data arrives, it updates the positions of these lines automatically.
Summary for the User
Essentially, this tool acts as a visual roadmap. It takes past price behavior and projects "zones of interest" onto your current chart, helping you see where the market might behave predictably without you having to perform any manual math or calculations.
//+-------------------------------------------------------------------+
//|                                                         Pivot.mq4 |
//|                       Copyright © 2004, MetaQuotes Software Corp. |
//|                                         http://www.metaquotes.net |
//|                                     Modified by Alejandro Galindo |
//|                                                                   |
//|                                            You are free to use it |
//|                                                                   |
//|      If you want, and if this work/modification is helpful to you |
//|                      send me a PayPal donation to ag@elcactus.com |
//+-------------------------------------------------------------------+
#property copyright "Copyright © 2004, MetaQuotes Software Corp."
#property link "http://www.metaquotes.net"


#property indicator_chart_window
#property indicator_buffers 1
#property indicator_color1 EMPTY


extern bool pivots = true;
extern bool camarilla = false;
extern bool midpivots = true;
extern int MyPeriod = PERIOD_D1;
/*+----------------------------------------------------+
 MyPeriod = Period in minutes to consideration, could be:
 1440 for D1
 60 for H1
 240 for H4
 1 for M1
 15 for M15
 30 for M30
 5 for M5
 43200 for MN1
 10080 for W1
 +-------------------------------------------------------*/


double day_high=0;
double day_low=0;
double yesterday_high=0;
double yesterday_open=0;
double yesterday_low=0;
double yesterday_close=0;
double today_open=0;
double today_high=0;
double today_low=0;
double P=0;
double Q=0;
double R1,R2,R3;
double M0,M1,M2,M3,M4,M5;
double S1,S2,S3;
double H4,H3,L4,L3;
double nQ=0;
double nD=0;
double D=0;
double rates_d1[2][6];
double ExtMapBuffer1[];
//+------------------------------------------------------------------+
//| Custom indicator initialization function |
//+------------------------------------------------------------------+
int init()
{
IndicatorBuffers(4);
SetIndexStyle(0,DRAW_ARROW);
SetIndexArrow(0,159);
SetIndexBuffer(0, ExtMapBuffer1);

//---- indicators
R1=0; R2=0; R3=0;
M0=0; M1=0; M2=0; M3=0; M4=0; M5=0;
S1=0; S2=0; S3=0;
H4=0; H3=0; L4=0; L3=0;


//----
return(0);
}
//+------------------------------------------------------------------+
//| Custor indicator deinitialization function |
//+------------------------------------------------------------------+
int deinit()
{
//---- TODO: add your code here
ObjectDelete("R1 Label");
ObjectDelete("R1 Line");
ObjectDelete("R2 Label");
ObjectDelete("R2 Line");
ObjectDelete("R3 Label");
ObjectDelete("R3 Line");
ObjectDelete("S1 Label");
ObjectDelete("S1 Line");
ObjectDelete("S2 Label");
ObjectDelete("S2 Line");
ObjectDelete("S3 Label");
ObjectDelete("S3 Line");
ObjectDelete("P Label");
ObjectDelete("P Line");
ObjectDelete("H4 Label");
ObjectDelete("H4 Line");
ObjectDelete("H3 Label");
ObjectDelete("H3 Line");
ObjectDelete("L3 Label");
ObjectDelete("L3 Line");
ObjectDelete("L4 Label");
ObjectDelete("L4 Line");
ObjectDelete("M5 Label");
ObjectDelete("M5 Line");
ObjectDelete("M4 Label");
ObjectDelete("M4 Line");
ObjectDelete("M3 Label");
ObjectDelete("M3 Line");
ObjectDelete("M2 Label");
ObjectDelete("M2 Line");
ObjectDelete("M1 Label");
ObjectDelete("M1 Line");
ObjectDelete("M0 Label");
ObjectDelete("M0 Line");
//----
return(0);
}
//+------------------------------------------------------------------+
//| Custom indicator iteration function |
//+------------------------------------------------------------------+
int start()
{

//---- TODO: add your code here

//---- exit if period is greater than daily charts
if(Period() > 1440)
{
Print("Error - Chart period is greater than 1 day.");
return(-1); // then exit
}

//---- Get new daily prices

ArrayCopyRates(rates_d1, Symbol(), MyPeriod);

yesterday_close = rates_d1[1][4];
yesterday_open = rates_d1[1][1];
today_open = rates_d1[0][1];
yesterday_high = rates_d1[1][3];
yesterday_low = rates_d1[1][2];
day_high = rates_d1[0][3];
day_low = rates_d1[0][2];


//---- Calculate Pivots

D = (day_high - day_low);
Q = (yesterday_high - yesterday_low);
P = (yesterday_high + yesterday_low + yesterday_close) / 3;
R1 = (2*P)-yesterday_low;
S1 = (2*P)-yesterday_high;
R2 = P+(yesterday_high - yesterday_low);
S2 = P-(yesterday_high - yesterday_low);

H4 = (Q*0.55)+yesterday_close;
H3 = (Q*0.27)+yesterday_close;
R3 = (2*P)+(yesterday_high-(2*yesterday_low));
M5 = (R2+R3)/2;
// R2 = P-S1+R1;
M4 = (R1+R2)/2;
// R1 = (2*P)-yesterday_low;
M3 = (P+R1)/2;
// P = (yesterday_high + yesterday_low + yesterday_close)/3;
M2 = (P+S1)/2;
// S1 = (2*P)-yesterday_high;
M1 = (S1+S2)/2;
// S2 = P-R1+S1;
S3 = (2*P)-((2* yesterday_high)-yesterday_low);
L3 = yesterday_close-(Q*0.27);
L4 = yesterday_close-(Q*0.55);
M0 = (S2+S3)/2;

if (Q > 5)
{
nQ = Q;
}
else
{
nQ = Q*10000;
}

if (D > 5)
{
nD = D;
}
else
{
nD = D*10000;
}


Comment("High= ",yesterday_high," Previous DaysRange= ",nQ,"\nLow= ",yesterday_low," Current DaysRange= ",nD,"\nClose= ",yesterday_close);

//---- Set line labels on chart window

//---- Pivot Lines
if (pivots==true)
{
if(ObjectFind("R1 label") != 0)
{
ObjectCreate("R1 label", OBJ_TEXT, 0, Time[0], R1);
ObjectSetText("R1 label", " R1", 8, "Arial", EMPTY);
}
else
{
ObjectMove("R1 label", 0, Time[0], R1);
}

if(ObjectFind("R2 label") != 0)
{
ObjectCreate("R2 label", OBJ_TEXT, 0, Time[20], R2);
ObjectSetText("R2 label", " R2", 8, "Arial", EMPTY);
}
else
{
ObjectMove("R2 label", 0, Time[20], R2);
}

if(ObjectFind("R3 label") != 0)
{
ObjectCreate("R3 label", OBJ_TEXT, 0, Time[20], R3);
ObjectSetText("R3 label", " R3", 8, "Arial", EMPTY);
}
else
{
ObjectMove("R3 label", 0, Time[20], R3);
}

if(ObjectFind("P label") != 0)
{
ObjectCreate("P label", OBJ_TEXT, 0, Time[0], P);
ObjectSetText("P label", "Pivot " +DoubleToStr(P,4), 8, "Arial",
EMPTY);
}
else
{
ObjectMove("P label", 0, Time[0], P);
}

if(ObjectFind("S1 label") != 0)
{
ObjectCreate("S1 label", OBJ_TEXT, 0, Time[0], S1);
ObjectSetText("S1 label", "S1", 8, "Arial", EMPTY);
}
else
{
ObjectMove("S1 label", 0, Time[0], S1);
}

if(ObjectFind("S2 label") != 0)
{
ObjectCreate("S2 label", OBJ_TEXT, 0, Time[20], S2);
ObjectSetText("S2 label", "S2", 8, "Arial", EMPTY);
}
else
{
ObjectMove("S2 label", 0, Time[20], S2);
}

if(ObjectFind("S3 label") != 0)
{
ObjectCreate("S3 label", OBJ_TEXT, 0, Time[20], S3);
ObjectSetText("S3 label", "S3", 8, "Arial", EMPTY);
}
else
{
ObjectMove("S3 label", 0, Time[20], S3);
}

//--- Draw Pivot lines on chart
if(ObjectFind("S1 line") != 0)
{
ObjectCreate("S1 line", OBJ_HLINE, 0, Time[40], S1);
ObjectSet("S1 line", OBJPROP_STYLE, STYLE_DASHDOTDOT);
ObjectSet("S1 line", OBJPROP_COLOR, MidnightBlue);
}
else
{
ObjectMove("S1 line", 0, Time[40], S1);
}

if(ObjectFind("S2 line") != 0)
{
ObjectCreate("S2 line", OBJ_HLINE, 0, Time[40], S2);
ObjectSet("S2 line", OBJPROP_STYLE, STYLE_DASHDOTDOT);
ObjectSet("S2 line", OBJPROP_COLOR, MidnightBlue);
}
else
{
ObjectMove("S2 line", 0, Time[40], S2);
}

if(ObjectFind("S3 line") != 0)
{
ObjectCreate("S3 line", OBJ_HLINE, 0, Time[40], S3);
ObjectSet("S3 line", OBJPROP_STYLE, STYLE_DASHDOTDOT);
ObjectSet("S3 line", OBJPROP_COLOR, MidnightBlue);
}
else
{
ObjectMove("S3 line", 0, Time[40], S3);
}

if(ObjectFind("P line") != 0)
{
ObjectCreate("P line", OBJ_HLINE, 0, Time[40], P);
ObjectSet("P line", OBJPROP_STYLE, STYLE_DOT);
ObjectSet("P line", OBJPROP_COLOR, YellowGreen);
}
else
{
ObjectMove("P line", 0, Time[40], P);
}

if(ObjectFind("R1 line") != 0)
{
ObjectCreate("R1 line", OBJ_HLINE, 0, Time[40], R1);
ObjectSet("R1 line", OBJPROP_STYLE, STYLE_DASHDOTDOT);
ObjectSet("R1 line", OBJPROP_COLOR, FireBrick);
}
else
{
ObjectMove("R1 line", 0, Time[40], R1);
}

if(ObjectFind("R2 line") != 0)
{
ObjectCreate("R2 line", OBJ_HLINE, 0, Time[40], R2);
ObjectSet("R2 line", OBJPROP_STYLE, STYLE_DASHDOTDOT);
ObjectSet("R2 line", OBJPROP_COLOR, FireBrick);
}
else
{
ObjectMove("R2 line", 0, Time[40], R2);
}

if(ObjectFind("R3 line") != 0)
{
ObjectCreate("R3 line", OBJ_HLINE, 0, Time[40], R3);
ObjectSet("R3 line", OBJPROP_STYLE, STYLE_DASHDOTDOT);
ObjectSet("R3 line", OBJPROP_COLOR, FireBrick);
}
else
{
ObjectMove("R3 line", 0, Time[40], R3);
}
}
//---- End of Pivot Line Draw


//----- Camarilla Lines

if (camarilla==true)
{
if(ObjectFind("H4 label") != 0)
{
ObjectCreate("H4 label", OBJ_TEXT, 0, Time[20], H4);
ObjectSetText("H4 label", " H4", 8, "Arial", EMPTY);
}
else
{
ObjectMove("H4 label", 0, Time[20], H4);
}

if(ObjectFind("H3 label") != 0)
{
ObjectCreate("H3 label", OBJ_TEXT, 0, Time[20], H3);
ObjectSetText("H3 label", " H3", 8, "Arial", EMPTY);
}
else
{
ObjectMove("H3 label", 0, Time[20], H3);
}

if(ObjectFind("L3 label") != 0)
{
ObjectCreate("L3 label", OBJ_TEXT, 0, Time[20], L3);
ObjectSetText("L3 label", " L3", 8, "Arial", EMPTY);
}
else
{
ObjectMove("L3 label", 0, Time[20], L3);
}

if(ObjectFind("L4 label") != 0)
{
ObjectCreate("L4 label", OBJ_TEXT, 0, Time[20], L4);
ObjectSetText("L4 label", " L4", 8, "Arial", EMPTY);
}
else
{
ObjectMove("L4 label", 0, Time[20], L4);
}

//---- Draw Camarilla lines on Chart
if(ObjectFind("H4 line") != 0)
{
ObjectCreate("H4 line", OBJ_HLINE, 0, Time[40], H4);
ObjectSet("H4 line", OBJPROP_STYLE, STYLE_DASHDOTDOT);
ObjectSet("H4 line", OBJPROP_COLOR, DimGray);
}
else
{
ObjectMove("H4 line", 0, Time[40], H4);
}

if(ObjectFind("H3 line") != 0)
{
ObjectCreate("H3 line", OBJ_HLINE, 0, Time[40], H3);
ObjectSet("H3 line", OBJPROP_STYLE, STYLE_DASHDOTDOT);
ObjectSet("H3 line", OBJPROP_COLOR, DimGray);
}
else
{
ObjectMove("H3 line", 0, Time[40], H3);
}

if(ObjectFind("L3 line") != 0)
{
ObjectCreate("L3 line", OBJ_HLINE, 0, Time[40], L3);
ObjectSet("L3 line", OBJPROP_STYLE, STYLE_DASHDOTDOT);
ObjectSet("L3 line", OBJPROP_COLOR, DimGray);
}
else
{
ObjectMove("L3 line", 0, Time[40], L3);
}

if(ObjectFind("L4 line") != 0)
{
ObjectCreate("L4 line", OBJ_HLINE, 0, Time[40], L4);
ObjectSet("L4 line", OBJPROP_STYLE, STYLE_DASHDOTDOT);
ObjectSet("L4 line", OBJPROP_COLOR, DimGray);
}
else
{
ObjectMove("L4 line", 0, Time[40], L4);
}
}
//-------End of Draw Camarilla Lines

//------ Midpoints Pivots

if (midpivots==true)
{

if(ObjectFind("M5 label") != 0)
{
ObjectCreate("M5 label", OBJ_TEXT, 0, Time[20], M5);
ObjectSetText("M5 label", " M5", 8, "Arial", EMPTY);
}
else
{
ObjectMove("M5 label", 0, Time[20], M5);
}

if(ObjectFind("M4 label") != 0)
{
ObjectCreate("M4 label", OBJ_TEXT, 0, Time[20], M4);
ObjectSetText("M4 label", " M4", 8, "Arial", EMPTY);
}
else
{
ObjectMove("M4 label", 0, Time[20], M4);
}

if(ObjectFind("M3 label") != 0)
{
ObjectCreate("M3 label", OBJ_TEXT, 0, Time[20], M3);
ObjectSetText("M3 label", " M3", 8, "Arial", EMPTY);
}
else
{
ObjectMove("M3 label", 0, Time[20], M3);
}

if(ObjectFind("M2 label") != 0)
{
ObjectCreate("M2 label", OBJ_TEXT, 0, Time[20], M2);
ObjectSetText("M2 label", " M2", 8, "Arial", EMPTY);
}
else
{
ObjectMove("M2 label", 0, Time[20], M2);
}

if(ObjectFind("M1 label") != 0)
{
ObjectCreate("M1 label", OBJ_TEXT, 0, Time[20], M1);
ObjectSetText("M1 label", " M1", 8, "Arial", EMPTY);
}
else
{
ObjectMove("M1 label", 0, Time[20], M1);
}

if(ObjectFind("M0 label") != 0)
{
ObjectCreate("M0 label", OBJ_TEXT, 0, Time[20], M0);
ObjectSetText("M0 label", " M0", 8, "Arial", EMPTY);
}
else
{
ObjectMove("M0 label", 0, Time[20], M0);
}

//---- Draw Midpoint Pivots on Chart
if(ObjectFind("M5 line") != 0)
{
ObjectCreate("M5 line", OBJ_HLINE, 0, Time[40], M5);
ObjectSet("M5 line", OBJPROP_STYLE, STYLE_DASHDOTDOT);
ObjectSet("M5 line", OBJPROP_COLOR, DimGray);
}
else
{
ObjectMove("M5 line", 0, Time[40], M5);
}

if(ObjectFind("M4 line") != 0)
{
ObjectCreate("M4 line", OBJ_HLINE, 0, Time[40], M4);
ObjectSet("M4 line", OBJPROP_STYLE, STYLE_DASHDOTDOT);
ObjectSet("M4 line", OBJPROP_COLOR, DimGray);
}
else
{
ObjectMove("M4 line", 0, Time[40], M4);
}

if(ObjectFind("M3 line") != 0)
{
ObjectCreate("M3 line", OBJ_HLINE, 0, Time[40], M3);
ObjectSet("M3 line", OBJPROP_STYLE, STYLE_DASHDOTDOT);
ObjectSet("M3 line", OBJPROP_COLOR, DimGray);
}
else
{
ObjectMove("M3 line", 0, Time[40], M3);
}

if(ObjectFind("M2 line") != 0)
{
ObjectCreate("M2 line", OBJ_HLINE, 0, Time[40], M2);
ObjectSet("M2 line", OBJPROP_STYLE, STYLE_DASHDOTDOT);
ObjectSet("M2 line", OBJPROP_COLOR, DimGray);
}
else
{
ObjectMove("M2 line", 0, Time[40], M2);
}

if(ObjectFind("M1 line") != 0)
{
ObjectCreate("M1 line", OBJ_HLINE, 0, Time[40], M1);
ObjectSet("M1 line", OBJPROP_STYLE, STYLE_DASHDOTDOT);
ObjectSet("M1 line", OBJPROP_COLOR, DimGray);
}
else
{
ObjectMove("M1 line", 0, Time[40], M1);
}

if(ObjectFind("M0 line") != 0)
{
ObjectCreate("M0 line", OBJ_HLINE, 0, Time[40], M0);
ObjectSet("M0 line", OBJPROP_STYLE, STYLE_DASHDOTDOT);
ObjectSet("M0 line", OBJPROP_COLOR, DimGray);
}
else
{
ObjectMove("M0 line", 0, Time[40], M0);
}

}
//----End of Midpoint Pivots Draw

//---- End Of Program
return(0);
}
//+------------------------------------------------------------------+
Comments