PivotCustomTime____
Download script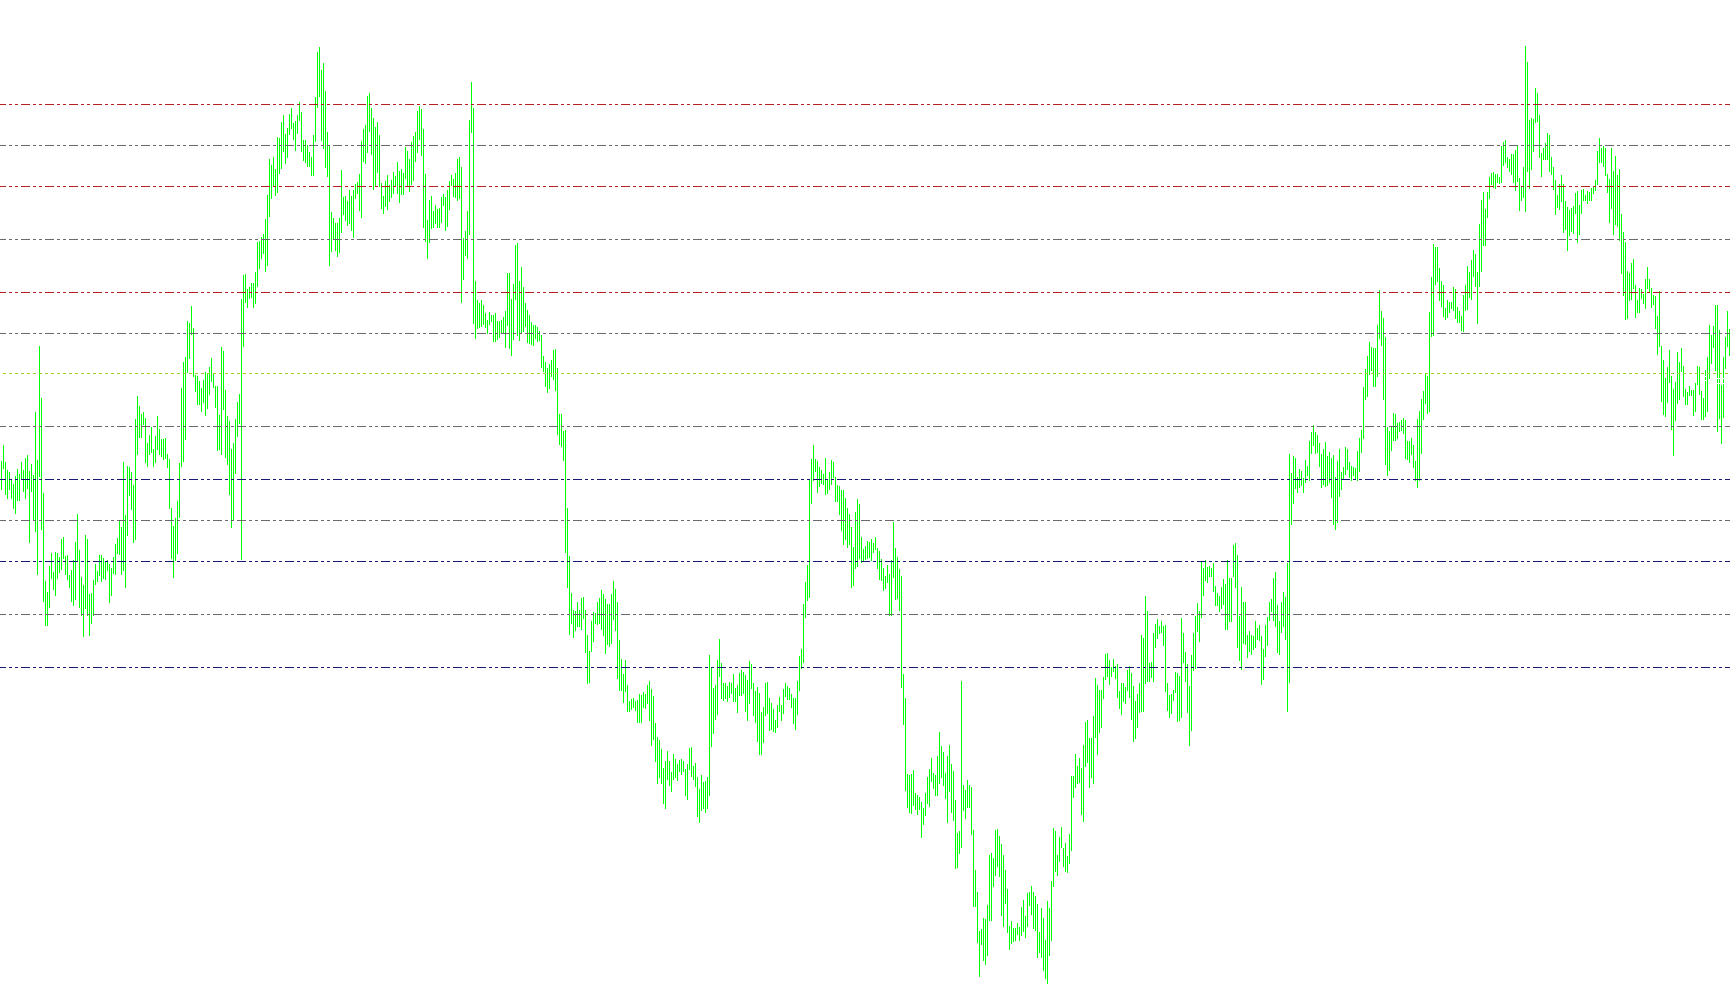
This script is designed to automatically calculate and display several types of technical analysis levels, known as "Pivots," directly on your trading chart. These levels help traders identify potential support and resistance areas—price points where the market might pause, reverse, or break through.
Here is a breakdown of the logic used by the tool:
Core Functionality
The script looks at historical price data (specifically the High, Low, and Close prices) from a preceding time period to calculate where the "turning points" for the current period might occur. By default, it focuses on daily data but can be adjusted to other timeframes.
Key Features and Calculations
1. Standard Pivot Points The script identifies the primary balance point of the market by taking the average of the previous day's high, low, and closing price. From this "Pivot," it generates:
- Resistance Levels (R1, R2, R3): Calculated areas where upward price movement may face difficulty.
- Support Levels (S1, S2, S3): Calculated areas where downward price movement may find a floor.
2. Camarilla Breakout Levels For traders who focus on volatility and specific breakout points, the script includes "Camarilla" levels (H3, H4, L3, L4). These are derived from a different mathematical formula that focuses on the range of the previous period to identify more aggressive potential reversal points.
3. Midpoint Pivots To provide a more granular view of the price action between the main support and resistance lines, the script can also display "Midpoints" (M0 through M5). These act as "sub-levels," helping traders see smaller zones of interest within the larger pivot structure.
User Experience & Visuals
- Dynamic Drawing: The script automatically creates horizontal lines and text labels on your chart. It updates these positions in real-time based on new price data.
- Visual Distinction: To keep the chart readable, the script uses different colors and line styles (such as solid dots vs. dashed lines) to distinguish between different types of levels.
- On-Screen Info: The tool provides a text summary in the corner of the screen, showing you the current high, low, and range values it is using for its calculations.
Operational Rules
- Timeframe Restriction: The script includes a safety check to ensure it is only used on charts that are smaller than a Daily chart (e.g., 1-hour, 4-hour, or 15-minute charts). If you try to use it on a Weekly or Monthly chart, the script will notify you of an error.
- Customizable Visibility: Through the settings, you can choose whether to show only the Standard Pivots, the Camarilla levels, the Midpoints, or a combination of all three.
/*-----------------------------+
|			       |
| Shared by www.Aptrafx.com    |
|			       |
+------------------------------*/

//+-------------------------------------------------------------------+
//|                                                         Pivot.mq4 |
//|                       Copyright © 2004, MetaQuotes Software Corp. |
//|                                         http://www.metaquotes.net |
//|                                     Modified by Alejandro Galindo |
//|                                                                   |
//|                                            You are free to use it |
//|                                                                   |
//|      If you want, and if this work/modification is helpful to you |
//|                      send me a PayPal donation to ag@elcactus.com |
//+-------------------------------------------------------------------+
#property copyright "Copyright © 2004, MetaQuotes Software Corp."
#property link "http://www.metaquotes.net"


#property indicator_chart_window
#property indicator_buffers 1
#property indicator_color1 EMPTY


extern bool pivots = true;
extern bool camarilla = false;
extern bool midpivots = true;
extern int MyPeriod = PERIOD_D1;
/*+----------------------------------------------------+
 MyPeriod = Period in minutes to consideration, could be:
 1440 for D1
 60 for H1
 240 for H4
 1 for M1
 15 for M15
 30 for M30
 5 for M5
 43200 for MN1
 10080 for W1
 +-------------------------------------------------------*/


double day_high=0;
double day_low=0;
double yesterday_high=0;
double yesterday_open=0;
double yesterday_low=0;
double yesterday_close=0;
double today_open=0;
double today_high=0;
double today_low=0;
double P=0;
double Q=0;
double R1,R2,R3;
double M0,M1,M2,M3,M4,M5;
double S1,S2,S3;
double H4,H3,L4,L3;
double nQ=0;
double nD=0;
double D=0;
double rates_d1[2][6];
double ExtMapBuffer1[];
//+------------------------------------------------------------------+
//| Custom indicator initialization function |
//+------------------------------------------------------------------+
int init()
{
IndicatorBuffers(4);
SetIndexStyle(0,DRAW_ARROW);
SetIndexArrow(0,159);
SetIndexBuffer(0, ExtMapBuffer1);

//---- indicators
R1=0; R2=0; R3=0;
M0=0; M1=0; M2=0; M3=0; M4=0; M5=0;
S1=0; S2=0; S3=0;
H4=0; H3=0; L4=0; L3=0;


//----
return(0);
}
//+------------------------------------------------------------------+
//| Custor indicator deinitialization function |
//+------------------------------------------------------------------+
int deinit()
{
//---- TODO: add your code here
ObjectDelete("R1 Label");
ObjectDelete("R1 Line");
ObjectDelete("R2 Label");
ObjectDelete("R2 Line");
ObjectDelete("R3 Label");
ObjectDelete("R3 Line");
ObjectDelete("S1 Label");
ObjectDelete("S1 Line");
ObjectDelete("S2 Label");
ObjectDelete("S2 Line");
ObjectDelete("S3 Label");
ObjectDelete("S3 Line");
ObjectDelete("P Label");
ObjectDelete("P Line");
ObjectDelete("H4 Label");
ObjectDelete("H4 Line");
ObjectDelete("H3 Label");
ObjectDelete("H3 Line");
ObjectDelete("L3 Label");
ObjectDelete("L3 Line");
ObjectDelete("L4 Label");
ObjectDelete("L4 Line");
ObjectDelete("M5 Label");
ObjectDelete("M5 Line");
ObjectDelete("M4 Label");
ObjectDelete("M4 Line");
ObjectDelete("M3 Label");
ObjectDelete("M3 Line");
ObjectDelete("M2 Label");
ObjectDelete("M2 Line");
ObjectDelete("M1 Label");
ObjectDelete("M1 Line");
ObjectDelete("M0 Label");
ObjectDelete("M0 Line");
//----
return(0);
}
//+------------------------------------------------------------------+
//| Custom indicator iteration function |
//+------------------------------------------------------------------+
int start()
{

//---- TODO: add your code here

//---- exit if period is greater than daily charts
if(Period() > 1440)
{
Print("Error - Chart period is greater than 1 day.");
return(-1); // then exit
}

//---- Get new daily prices

ArrayCopyRates(rates_d1, Symbol(), MyPeriod);

yesterday_close = rates_d1[1][4];
yesterday_open = rates_d1[1][1];
today_open = rates_d1[0][1];
yesterday_high = rates_d1[1][3];
yesterday_low = rates_d1[1][2];
day_high = rates_d1[0][3];
day_low = rates_d1[0][2];


//---- Calculate Pivots

D = (day_high - day_low);
Q = (yesterday_high - yesterday_low);
P = (yesterday_high + yesterday_low + yesterday_close) / 3;
R1 = (2*P)-yesterday_low;
S1 = (2*P)-yesterday_high;
R2 = P+(yesterday_high - yesterday_low);
S2 = P-(yesterday_high - yesterday_low);

H4 = (Q*0.55)+yesterday_close;
H3 = (Q*0.27)+yesterday_close;
R3 = (2*P)+(yesterday_high-(2*yesterday_low));
M5 = (R2+R3)/2;
// R2 = P-S1+R1;
M4 = (R1+R2)/2;
// R1 = (2*P)-yesterday_low;
M3 = (P+R1)/2;
// P = (yesterday_high + yesterday_low + yesterday_close)/3;
M2 = (P+S1)/2;
// S1 = (2*P)-yesterday_high;
M1 = (S1+S2)/2;
// S2 = P-R1+S1;
S3 = (2*P)-((2* yesterday_high)-yesterday_low);
L3 = yesterday_close-(Q*0.27);
L4 = yesterday_close-(Q*0.55);
M0 = (S2+S3)/2;

if (Q > 5)
{
nQ = Q;
}
else
{
nQ = Q*10000;
}

if (D > 5)
{
nD = D;
}
else
{
nD = D*10000;
}


Comment("High= ",yesterday_high," Previous DaysRange= ",nQ,"\nLow= ",yesterday_low," Current DaysRange= ",nD,"\nClose= ",yesterday_close);

//---- Set line labels on chart window

//---- Pivot Lines
if (pivots==true)
{
if(ObjectFind("R1 label") != 0)
{
ObjectCreate("R1 label", OBJ_TEXT, 0, Time[0], R1);
ObjectSetText("R1 label", " R1", 8, "Arial", EMPTY);
}
else
{
ObjectMove("R1 label", 0, Time[0], R1);
}

if(ObjectFind("R2 label") != 0)
{
ObjectCreate("R2 label", OBJ_TEXT, 0, Time[20], R2);
ObjectSetText("R2 label", " R2", 8, "Arial", EMPTY);
}
else
{
ObjectMove("R2 label", 0, Time[20], R2);
}

if(ObjectFind("R3 label") != 0)
{
ObjectCreate("R3 label", OBJ_TEXT, 0, Time[20], R3);
ObjectSetText("R3 label", " R3", 8, "Arial", EMPTY);
}
else
{
ObjectMove("R3 label", 0, Time[20], R3);
}

if(ObjectFind("P label") != 0)
{
ObjectCreate("P label", OBJ_TEXT, 0, Time[0], P);
ObjectSetText("P label", "Pivot " +DoubleToStr(P,4), 8, "Arial",
EMPTY);
}
else
{
ObjectMove("P label", 0, Time[0], P);
}

if(ObjectFind("S1 label") != 0)
{
ObjectCreate("S1 label", OBJ_TEXT, 0, Time[0], S1);
ObjectSetText("S1 label", "S1", 8, "Arial", EMPTY);
}
else
{
ObjectMove("S1 label", 0, Time[0], S1);
}

if(ObjectFind("S2 label") != 0)
{
ObjectCreate("S2 label", OBJ_TEXT, 0, Time[20], S2);
ObjectSetText("S2 label", "S2", 8, "Arial", EMPTY);
}
else
{
ObjectMove("S2 label", 0, Time[20], S2);
}

if(ObjectFind("S3 label") != 0)
{
ObjectCreate("S3 label", OBJ_TEXT, 0, Time[20], S3);
ObjectSetText("S3 label", "S3", 8, "Arial", EMPTY);
}
else
{
ObjectMove("S3 label", 0, Time[20], S3);
}

//--- Draw Pivot lines on chart
if(ObjectFind("S1 line") != 0)
{
ObjectCreate("S1 line", OBJ_HLINE, 0, Time[40], S1);
ObjectSet("S1 line", OBJPROP_STYLE, STYLE_DASHDOTDOT);
ObjectSet("S1 line", OBJPROP_COLOR, MidnightBlue);
}
else
{
ObjectMove("S1 line", 0, Time[40], S1);
}

if(ObjectFind("S2 line") != 0)
{
ObjectCreate("S2 line", OBJ_HLINE, 0, Time[40], S2);
ObjectSet("S2 line", OBJPROP_STYLE, STYLE_DASHDOTDOT);
ObjectSet("S2 line", OBJPROP_COLOR, MidnightBlue);
}
else
{
ObjectMove("S2 line", 0, Time[40], S2);
}

if(ObjectFind("S3 line") != 0)
{
ObjectCreate("S3 line", OBJ_HLINE, 0, Time[40], S3);
ObjectSet("S3 line", OBJPROP_STYLE, STYLE_DASHDOTDOT);
ObjectSet("S3 line", OBJPROP_COLOR, MidnightBlue);
}
else
{
ObjectMove("S3 line", 0, Time[40], S3);
}

if(ObjectFind("P line") != 0)
{
ObjectCreate("P line", OBJ_HLINE, 0, Time[40], P);
ObjectSet("P line", OBJPROP_STYLE, STYLE_DOT);
ObjectSet("P line", OBJPROP_COLOR, YellowGreen);
}
else
{
ObjectMove("P line", 0, Time[40], P);
}

if(ObjectFind("R1 line") != 0)
{
ObjectCreate("R1 line", OBJ_HLINE, 0, Time[40], R1);
ObjectSet("R1 line", OBJPROP_STYLE, STYLE_DASHDOTDOT);
ObjectSet("R1 line", OBJPROP_COLOR, FireBrick);
}
else
{
ObjectMove("R1 line", 0, Time[40], R1);
}

if(ObjectFind("R2 line") != 0)
{
ObjectCreate("R2 line", OBJ_HLINE, 0, Time[40], R2);
ObjectSet("R2 line", OBJPROP_STYLE, STYLE_DASHDOTDOT);
ObjectSet("R2 line", OBJPROP_COLOR, FireBrick);
}
else
{
ObjectMove("R2 line", 0, Time[40], R2);
}

if(ObjectFind("R3 line") != 0)
{
ObjectCreate("R3 line", OBJ_HLINE, 0, Time[40], R3);
ObjectSet("R3 line", OBJPROP_STYLE, STYLE_DASHDOTDOT);
ObjectSet("R3 line", OBJPROP_COLOR, FireBrick);
}
else
{
ObjectMove("R3 line", 0, Time[40], R3);
}
}
//---- End of Pivot Line Draw


//----- Camarilla Lines

if (camarilla==true)
{
if(ObjectFind("H4 label") != 0)
{
ObjectCreate("H4 label", OBJ_TEXT, 0, Time[20], H4);
ObjectSetText("H4 label", " H4", 8, "Arial", EMPTY);
}
else
{
ObjectMove("H4 label", 0, Time[20], H4);
}

if(ObjectFind("H3 label") != 0)
{
ObjectCreate("H3 label", OBJ_TEXT, 0, Time[20], H3);
ObjectSetText("H3 label", " H3", 8, "Arial", EMPTY);
}
else
{
ObjectMove("H3 label", 0, Time[20], H3);
}

if(ObjectFind("L3 label") != 0)
{
ObjectCreate("L3 label", OBJ_TEXT, 0, Time[20], L3);
ObjectSetText("L3 label", " L3", 8, "Arial", EMPTY);
}
else
{
ObjectMove("L3 label", 0, Time[20], L3);
}

if(ObjectFind("L4 label") != 0)
{
ObjectCreate("L4 label", OBJ_TEXT, 0, Time[20], L4);
ObjectSetText("L4 label", " L4", 8, "Arial", EMPTY);
}
else
{
ObjectMove("L4 label", 0, Time[20], L4);
}

//---- Draw Camarilla lines on Chart
if(ObjectFind("H4 line") != 0)
{
ObjectCreate("H4 line", OBJ_HLINE, 0, Time[40], H4);
ObjectSet("H4 line", OBJPROP_STYLE, STYLE_DASHDOTDOT);
ObjectSet("H4 line", OBJPROP_COLOR, DimGray);
}
else
{
ObjectMove("H4 line", 0, Time[40], H4);
}

if(ObjectFind("H3 line") != 0)
{
ObjectCreate("H3 line", OBJ_HLINE, 0, Time[40], H3);
ObjectSet("H3 line", OBJPROP_STYLE, STYLE_DASHDOTDOT);
ObjectSet("H3 line", OBJPROP_COLOR, DimGray);
}
else
{
ObjectMove("H3 line", 0, Time[40], H3);
}

if(ObjectFind("L3 line") != 0)
{
ObjectCreate("L3 line", OBJ_HLINE, 0, Time[40], L3);
ObjectSet("L3 line", OBJPROP_STYLE, STYLE_DASHDOTDOT);
ObjectSet("L3 line", OBJPROP_COLOR, DimGray);
}
else
{
ObjectMove("L3 line", 0, Time[40], L3);
}

if(ObjectFind("L4 line") != 0)
{
ObjectCreate("L4 line", OBJ_HLINE, 0, Time[40], L4);
ObjectSet("L4 line", OBJPROP_STYLE, STYLE_DASHDOTDOT);
ObjectSet("L4 line", OBJPROP_COLOR, DimGray);
}
else
{
ObjectMove("L4 line", 0, Time[40], L4);
}
}
//-------End of Draw Camarilla Lines

//------ Midpoints Pivots

if (midpivots==true)
{

if(ObjectFind("M5 label") != 0)
{
ObjectCreate("M5 label", OBJ_TEXT, 0, Time[20], M5);
ObjectSetText("M5 label", " M5", 8, "Arial", EMPTY);
}
else
{
ObjectMove("M5 label", 0, Time[20], M5);
}

if(ObjectFind("M4 label") != 0)
{
ObjectCreate("M4 label", OBJ_TEXT, 0, Time[20], M4);
ObjectSetText("M4 label", " M4", 8, "Arial", EMPTY);
}
else
{
ObjectMove("M4 label", 0, Time[20], M4);
}

if(ObjectFind("M3 label") != 0)
{
ObjectCreate("M3 label", OBJ_TEXT, 0, Time[20], M3);
ObjectSetText("M3 label", " M3", 8, "Arial", EMPTY);
}
else
{
ObjectMove("M3 label", 0, Time[20], M3);
}

if(ObjectFind("M2 label") != 0)
{
ObjectCreate("M2 label", OBJ_TEXT, 0, Time[20], M2);
ObjectSetText("M2 label", " M2", 8, "Arial", EMPTY);
}
else
{
ObjectMove("M2 label", 0, Time[20], M2);
}

if(ObjectFind("M1 label") != 0)
{
ObjectCreate("M1 label", OBJ_TEXT, 0, Time[20], M1);
ObjectSetText("M1 label", " M1", 8, "Arial", EMPTY);
}
else
{
ObjectMove("M1 label", 0, Time[20], M1);
}

if(ObjectFind("M0 label") != 0)
{
ObjectCreate("M0 label", OBJ_TEXT, 0, Time[20], M0);
ObjectSetText("M0 label", " M0", 8, "Arial", EMPTY);
}
else
{
ObjectMove("M0 label", 0, Time[20], M0);
}

//---- Draw Midpoint Pivots on Chart
if(ObjectFind("M5 line") != 0)
{
ObjectCreate("M5 line", OBJ_HLINE, 0, Time[40], M5);
ObjectSet("M5 line", OBJPROP_STYLE, STYLE_DASHDOTDOT);
ObjectSet("M5 line", OBJPROP_COLOR, DimGray);
}
else
{
ObjectMove("M5 line", 0, Time[40], M5);
}

if(ObjectFind("M4 line") != 0)
{
ObjectCreate("M4 line", OBJ_HLINE, 0, Time[40], M4);
ObjectSet("M4 line", OBJPROP_STYLE, STYLE_DASHDOTDOT);
ObjectSet("M4 line", OBJPROP_COLOR, DimGray);
}
else
{
ObjectMove("M4 line", 0, Time[40], M4);
}

if(ObjectFind("M3 line") != 0)
{
ObjectCreate("M3 line", OBJ_HLINE, 0, Time[40], M3);
ObjectSet("M3 line", OBJPROP_STYLE, STYLE_DASHDOTDOT);
ObjectSet("M3 line", OBJPROP_COLOR, DimGray);
}
else
{
ObjectMove("M3 line", 0, Time[40], M3);
}

if(ObjectFind("M2 line") != 0)
{
ObjectCreate("M2 line", OBJ_HLINE, 0, Time[40], M2);
ObjectSet("M2 line", OBJPROP_STYLE, STYLE_DASHDOTDOT);
ObjectSet("M2 line", OBJPROP_COLOR, DimGray);
}
else
{
ObjectMove("M2 line", 0, Time[40], M2);
}

if(ObjectFind("M1 line") != 0)
{
ObjectCreate("M1 line", OBJ_HLINE, 0, Time[40], M1);
ObjectSet("M1 line", OBJPROP_STYLE, STYLE_DASHDOTDOT);
ObjectSet("M1 line", OBJPROP_COLOR, DimGray);
}
else
{
ObjectMove("M1 line", 0, Time[40], M1);
}

if(ObjectFind("M0 line") != 0)
{
ObjectCreate("M0 line", OBJ_HLINE, 0, Time[40], M0);
ObjectSet("M0 line", OBJPROP_STYLE, STYLE_DASHDOTDOT);
ObjectSet("M0 line", OBJPROP_COLOR, DimGray);
}
else
{
ObjectMove("M0 line", 0, Time[40], M0);
}

}
//----End of Midpoint Pivots Draw

//---- End Of Program
return(0);
}
//+------------------------------------------------------------------+
Comments