Pivots Custom_v1
Download script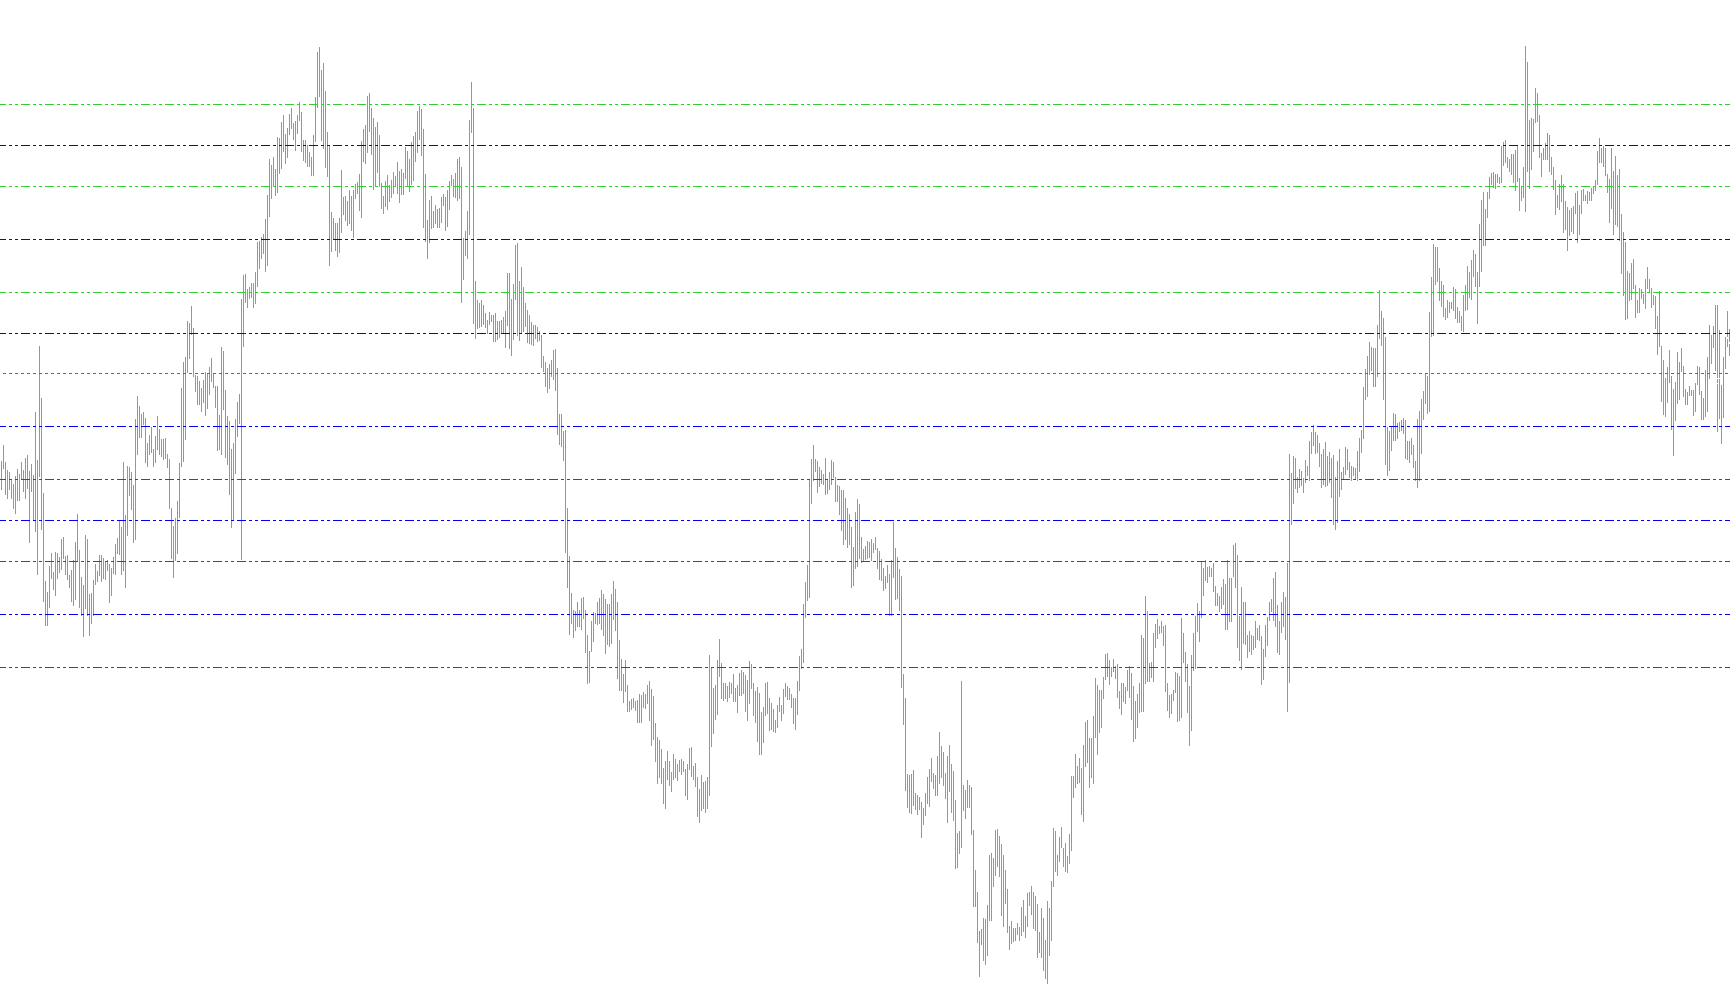
This script is a financial analysis tool designed for the MetaTrader platform to automatically identify and display key price levels, known as "Pivots," directly on your trading charts. Instead of requiring you to calculate complex mathematical formulas manually, the script processes historical data to project potential support and resistance zones.
Core Functionality
The logic operates by analyzing high, low, and closing prices from previous sessions (primarily focused on daily price action) to generate several distinct types of price levels:
- Standard Pivot Points: The script identifies the "Pivot" (P), which serves as a central balance point for the market. From this center, it calculates Resistance levels (R1, R2, R3) and Support levels (S1, S2, S3). These help traders understand where the price might face pressure to turn around or continue its trend.
- Camarilla Levels: This is a specialized calculation used by many breakout traders. The script identifies specific boundaries (H3, H4, L3, L4) that are often used to predict the trading range of the current period and identify potential "reversal" points for aggressive scalping or trend following.
- Midpoint Pivots: To provide a more granular view of the market structure, the script can also calculate intermediate levels (M0 through M5). These act as smaller "sub-levels" between the primary pivots, allowing for more precise entry and exit planning within a larger price range.
Data Processing Logic
- Timeframe Awareness: The script is designed to look at different timeframes (like Daily or Hourly) to pull the necessary data. It specifically looks back at "Yesterday's" high, low, and closing prices to build today's map.
- Automatic Calculation: Once it gathers these historical figures, it applies specific mathematical weights to determine where the lines should sit. For example, it calculates the range of the previous day and uses that volatility to set the distance for current support and resistance.
- Dynamic Visual Updates: The script continuously updates the chart in real-time. It creates horizontal lines and text labels that move with the current price action, ensuring that as new data comes in, your visual map of "where the price might go" remains accurate.
- On-Screen Information: In addition to drawing lines, the script provides a live "Comment" box on the chart. This gives you an at-a-glance summary of the current day's range, the previous day's range, and a countdown to the next candle.
User Experience
From a visitor's perspective, this tool acts as a visual "roadmap." By looking at the colored lines (Green for resistance, Red for support, Blue for midpoints, and Yellow for Camarilla), you can quickly see where the "walls" of the market are located, helping to take the guesswork out of identifying potential turning points during live trading sessions.
/*-----------------------------+
|			       |
| Shared by www.Aptrafx.com    |
|			       |
+------------------------------*/

//+------------------------------------------------------------------+
//|                                                        Pivot.mq4 |
//|                      Copyright © 2004, MetaQuotes Software Corp. |
//|                                        http://www.metaquotes.net |
//|                                                                  |
//|                                    Modified by Alejandro Galindo |
//|                                                  ag@elcactus.com |
//|                                                                  |
//|                         Additional Modifications by Trinity Webs |
//|                                     http://forex.trinitywebs.com |
//+------------------------------------------------------------------+
#property copyright "Copyright © 2004, MetaQuotes Software Corp."
#property link      "http://www.metaquotes.net"

#property indicator_chart_window
#property indicator_buffers 1
#property indicator_color1 CLR_NONE


extern bool pivots     = true;
extern bool camarilla  = false;
extern bool midpivots  = true;
extern int  TimeOffset = 0;
extern int  TimeFrame  = PERIOD_D1;
/*+----------------------------------------------------+
  Options for TimeFrame
       1 for M1
       5 for M5
      15 for M15
      30 for M30
      60 for H1
     240 for H4
    1440 for D1
   10080 for W1
   43200 for MN1
  +-------------------------------------------------------*/


double day_high=0;
double day_low=0;
double yesterday_high=0;
double yesterday_open=0;
double yesterday_low=0;
double yesterday_close=0;
double today_open=0;
double today_high=0;
double today_low=0;
double P=0;
double Q=0;
double R1,R2,R3;
double M0,M1,M2,M3,M4,M5;
double S1,S2,S3;
double H4,H3,L4,L3;
double nQ=0;
double nD=0;
double D=0;
double rates_d1[2][6];
double rates_h1[2][6];
double ExtMapBuffer1[];

//+------------------------------------------------------------------+
//| Custom indicator initialization function                         |
//+------------------------------------------------------------------+
int init() {
  IndicatorBuffers(4);
  SetIndexStyle(0,DRAW_ARROW);
  SetIndexArrow(0,159);
  SetIndexBuffer(0, ExtMapBuffer1);

  //---- indicators
  R1=0; R2=0; R3=0;
  M0=0; M1=0; M2=0; M3=0; M4=0; M5=0;
  S1=0; S2=0; S3=0;
  H4=0; H3=0; L4=0; L3=0;

  return(0);
}

//+------------------------------------------------------------------+
//| Custom indicator deinitialization function                       |
//+------------------------------------------------------------------+
int deinit() {
  ObjectDelete("R1 Label");
  ObjectDelete("R1 Line");
  ObjectDelete("R2 Label");
  ObjectDelete("R2 Line");
  ObjectDelete("R3 Label");
  ObjectDelete("R3 Line");
  ObjectDelete("S1 Label");
  ObjectDelete("S1 Line");
  ObjectDelete("S2 Label");
  ObjectDelete("S2 Line");
  ObjectDelete("S3 Label");
  ObjectDelete("S3 Line");
  ObjectDelete("P Label");
  ObjectDelete("P Line");
  ObjectDelete("H4 Label");
  ObjectDelete("H4 Line");
  ObjectDelete("H3 Label");
  ObjectDelete("H3 Line");
  ObjectDelete("L3 Label");
  ObjectDelete("L3 Line");
  ObjectDelete("L4 Label");
  ObjectDelete("L4 Line");
  ObjectDelete("M5 Label");
  ObjectDelete("M5 Line");
  ObjectDelete("M4 Label");
  ObjectDelete("M4 Line");
  ObjectDelete("M3 Label");
  ObjectDelete("M3 Line");
  ObjectDelete("M2 Label");
  ObjectDelete("M2 Line");
  ObjectDelete("M1 Label");
  ObjectDelete("M1 Line");
  ObjectDelete("M0 Label");
  ObjectDelete("M0 Line");
  return(0);
}

//+------------------------------------------------------------------+
//| Custom indicator iteration function                              |
//+------------------------------------------------------------------+
int start()
  {

//---- TODO: add your code here
if (TimeFrame != 10080 && TimeFrame != 43200)
  TimeFrame = PERIOD_D1;

//if (TimeFrame < PERIOD_D1)
  //TimeFrame = PERIOD_D1;

//---- exit if period is greater than daily charts
if(Period() > 1440 && TimeFrame == PERIOD_D1) {
  Print("Error - Chart period is greater than 1 day.");
  return(-1); // then exit
}

//---- Get new daily prices

if (TimeFrame != PERIOD_D1) {
  ArrayCopyRates(rates_d1, Symbol(), TimeFrame);
  yesterday_close = rates_d1[1][4];
  yesterday_open = rates_d1[1][1];
  today_open = rates_d1[0][1];
  yesterday_high = rates_d1[1][3];
  yesterday_low = rates_d1[1][2];
  day_high = rates_d1[0][3];
  day_low = rates_d1[0][2];
}
else {
  ArrayCopyRates(rates_d1, Symbol(), PERIOD_D1);
  yesterday_high = rates_d1[1][3];
  yesterday_low = rates_d1[1][2];
  day_high = rates_d1[0][3];
  day_low = rates_d1[0][2];

  ArrayCopyRates(rates_h1, Symbol(), PERIOD_H1);
  for (int i=0; i<=25; i++)
  {
    if (TimeMinute(rates_h1[i][0]) == 0 && (TimeHour(rates_h1[i][0]) - TimeOffset) == 0)
    {
      yesterday_close = rates_h1[i+1][4];
      yesterday_open = rates_h1[i+24][1];
      today_open = rates_h1[i][1];
      break;
    }
  }
}

//---- Calculate Pivots

D = (day_high - day_low);
Q = (yesterday_high - yesterday_low);
P = (yesterday_high + yesterday_low + yesterday_close) / 3;
R1 = (2*P)-yesterday_low;
S1 = (2*P)-yesterday_high;
R2 = P+(yesterday_high - yesterday_low);
S2 = P-(yesterday_high - yesterday_low);

	H4 = (Q*0.55)+yesterday_close;
	H3 = (Q*0.27)+yesterday_close;
	R3 = (2*P)+(yesterday_high-(2*yesterday_low));
	M5 = (R2+R3)/2;
//	R2 = P-S1+R1;
	M4 = (R1+R2)/2;
//	R1 = (2*P)-yesterday_low;
	M3 = (P+R1)/2;
//	P = (yesterday_high + yesterday_low + yesterday_close)/3;
	M2 = (P+S1)/2;
//	S1 = (2*P)-yesterday_high;
	M1 = (S1+S2)/2;
//	S2 = P-R1+S1;
	S3 = (2*P)-((2* yesterday_high)-yesterday_low);
	L3 = yesterday_close-(Q*0.27);
	L4 = yesterday_close-(Q*0.55);
	M0 = (S2+S3)/2;

if (Q > 5)
{
	nQ = Q;
}
else
{
	nQ = Q*10000;
}

if (D > 5)
{
	nD = D;
}
else
{
	nD = D*10000;
}


//Comment("High= ",yesterday_high,"    Previous Days Range= ",nQ,"\nLow= ",yesterday_low,"    Current Days Range= ",nD,"\nClose= ",yesterday_close);

double seco= (Time[4]-Time[5])-MathMod(CurTime(),Time[4]-Time[5]);
double minu=seco/60;
seco=(minu-MathFloor(minu))*60;
minu=MathFloor(minu);

Comment("High= ",yesterday_high,"    Previous Days Range= ",nQ,"\nLow= ",yesterday_low,"    Current Days Range= ",nD,"\nClose= ",yesterday_close,"    Time Frame= ", TimeFrame, "\nTime for next bar: ",	minu," min ",seco," sec");

//---- Set line labels on chart window

//---- Pivot Lines
   if (pivots==true)
   {
      if(ObjectFind("R1 label") != 0)
      {
      ObjectCreate("R1 label", OBJ_TEXT, 0, Time[0], R1);
      ObjectSetText("R1 label", " R1", 8, "Arial", EMPTY);
      }
      else
      {
      ObjectMove("R1 label", 0, Time[0], R1);
      }

      if(ObjectFind("R2 label") != 0)
      {
      ObjectCreate("R2 label", OBJ_TEXT, 0, Time[0], R2);
      ObjectSetText("R2 label", " R2", 8, "Arial", EMPTY);
      }
      else
      {
      ObjectMove("R2 label", 0, Time[0], R2);
      }

      if(ObjectFind("R3 label") != 0)
      {
      ObjectCreate("R3 label", OBJ_TEXT, 0, Time[0], R3);
      ObjectSetText("R3 label", " R3", 8, "Arial", EMPTY);
      }
      else
      {
      ObjectMove("R3 label", 0, Time[0], R3);
      }

      if(ObjectFind("P label") != 0)
      {
      ObjectCreate("P label", OBJ_TEXT, 0, Time[0], P);
      ObjectSetText("P label", "Pivot  " +DoubleToStr(P,4), 8, "Arial", EMPTY);
      }
      else
      {
      ObjectMove("P label", 0, Time[0], P);
      }

      if(ObjectFind("S1 label") != 0)
      {
      ObjectCreate("S1 label", OBJ_TEXT, 0, Time[0], S1);
      ObjectSetText("S1 label", "S1", 8, "Arial", EMPTY);
      }
      else
      {
      ObjectMove("S1 label", 0, Time[0], S1);
      }

      if(ObjectFind("S2 label") != 0)
      {
      ObjectCreate("S2 label", OBJ_TEXT, 0, Time[0], S2);
      ObjectSetText("S2 label", "S2", 8, "Arial", EMPTY);
      }
      else
      {
      ObjectMove("S2 label", 0, Time[0], S2);
      }

      if(ObjectFind("S3 label") != 0)
      {
      ObjectCreate("S3 label", OBJ_TEXT, 0, Time[0], S3);
      ObjectSetText("S3 label", "S3", 8, "Arial", EMPTY);
      }
      else
      {
      ObjectMove("S3 label", 0, Time[0], S3);
      }

//---  Draw  Pivot lines on chart
      if(ObjectFind("S1 line") != 0)
      {
      ObjectCreate("S1 line", OBJ_HLINE, 0, Time[40], S1);
      ObjectSet("S1 line", OBJPROP_STYLE, STYLE_DASHDOTDOT);
      ObjectSet("S1 line", OBJPROP_COLOR, Red);
      }
      else
      {
      ObjectMove("S1 line", 0, Time[40], S1);
      //ObjectSet("S1 line", OBJPROP_COLOR, indicator_color1);
      }

      if(ObjectFind("S2 line") != 0)
      {
      ObjectCreate("S2 line", OBJ_HLINE, 0, Time[40], S2);
      ObjectSet("S2 line", OBJPROP_STYLE, STYLE_DASHDOTDOT);
      ObjectSet("S2 line", OBJPROP_COLOR, Red);
      }
      else
      {
      ObjectMove("S2 line", 0, Time[40], S2);
      }

      if(ObjectFind("S3 line") != 0)
      {
      ObjectCreate("S3 line", OBJ_HLINE, 0, Time[40], S3);
      ObjectSet("S3 line", OBJPROP_STYLE, STYLE_DASHDOTDOT);
      ObjectSet("S3 line", OBJPROP_COLOR, Red);
      }
      else
      {
      ObjectMove("S3 line", 0, Time[40], S3);
      }

      if(ObjectFind("P line") != 0)
      {
      ObjectCreate("P line", OBJ_HLINE, 0, Time[40], P);
      ObjectSet("P line", OBJPROP_STYLE, STYLE_DOT);
      ObjectSet("P line", OBJPROP_COLOR, Magenta);
      }
      else
      {
      ObjectMove("P line", 0, Time[40], P);
      }

      if(ObjectFind("R1 line") != 0)
      {
      ObjectCreate("R1 line", OBJ_HLINE, 0, Time[40], R1);
      ObjectSet("R1 line", OBJPROP_STYLE, STYLE_DASHDOTDOT);
      ObjectSet("R1 line", OBJPROP_COLOR, LimeGreen);
      }
      else
      {
      ObjectMove("R1 line", 0, Time[40], R1);
      }

      if(ObjectFind("R2 line") != 0)
      {
      ObjectCreate("R2 line", OBJ_HLINE, 0, Time[40], R2);
      ObjectSet("R2 line", OBJPROP_STYLE, STYLE_DASHDOTDOT);
      ObjectSet("R2 line", OBJPROP_COLOR, LimeGreen);
      }
      else
      {
      ObjectMove("R2 line", 0, Time[40], R2);
      }

      if(ObjectFind("R3 line") != 0)
      {
      ObjectCreate("R3 line", OBJ_HLINE, 0, Time[40], R3);
      ObjectSet("R3 line", OBJPROP_STYLE, STYLE_DASHDOTDOT);
      ObjectSet("R3 line", OBJPROP_COLOR, LimeGreen);
      }
      else
      {
      ObjectMove("R3 line", 0, Time[40], R3);
      }
   }
//---- End of Pivot Line Draw


//----- Camarilla Lines

   if (camarilla==true)
   {
      if(ObjectFind("H4 label") != 0)
      {
      ObjectCreate("H4 label", OBJ_TEXT, 0, Time[0], H4);
      ObjectSetText("H4 label", " H4", 8, "Arial", EMPTY);
      }
      else
      {
      ObjectMove("H4 label", 0, Time[0], H4);
      }

      if(ObjectFind("H3 label") != 0)
      {
      ObjectCreate("H3 label", OBJ_TEXT, 0, Time[0], H3);
      ObjectSetText("H3 label", " H3", 8, "Arial", EMPTY);
      }
      else
      {
      ObjectMove("H3 label", 0, Time[0], H3);
      }

      if(ObjectFind("L3 label") != 0)
      {
      ObjectCreate("L3 label", OBJ_TEXT, 0, Time[0], L3);
      ObjectSetText("L3 label", " L3", 8, "Arial", EMPTY);
      }
      else
      {
      ObjectMove("L3 label", 0, Time[0], L3);
      }

      if(ObjectFind("L4 label") != 0)
      {
      ObjectCreate("L4 label", OBJ_TEXT, 0, Time[0], L4);
      ObjectSetText("L4 label", " L4", 8, "Arial", EMPTY);
      }
      else
      {
      ObjectMove("L4 label", 0, Time[0], L4);
      }

//---- Draw Camarilla lines on Chart
      if(ObjectFind("H4 line") != 0)
      {
      ObjectCreate("H4 line", OBJ_HLINE, 0, Time[40], H4);
      ObjectSet("H4 line", OBJPROP_STYLE, STYLE_DASHDOTDOT);
      ObjectSet("H4 line", OBJPROP_COLOR, Yellow);
      }
      else
      {
      ObjectMove("H4 line", 0, Time[40], H4);
      }

      if(ObjectFind("H3 line") != 0)
      {
      ObjectCreate("H3 line", OBJ_HLINE, 0, Time[40], H3);
      ObjectSet("H3 line", OBJPROP_STYLE, STYLE_DASHDOTDOT);
      ObjectSet("H3 line", OBJPROP_COLOR, Yellow);
      }
      else
      {
      ObjectMove("H3 line", 0, Time[40], H3);
      }

      if(ObjectFind("L3 line") != 0)
      {
      ObjectCreate("L3 line", OBJ_HLINE, 0, Time[40], L3);
      ObjectSet("L3 line", OBJPROP_STYLE, STYLE_DASHDOTDOT);
      ObjectSet("L3 line", OBJPROP_COLOR, Yellow);
      }
      else
      {
      ObjectMove("L3 line", 0, Time[40], L3);
      }

      if(ObjectFind("L4 line") != 0)
      {
      ObjectCreate("L4 line", OBJ_HLINE, 0, Time[40], L4);
      ObjectSet("L4 line", OBJPROP_STYLE, STYLE_DASHDOTDOT);
      ObjectSet("L4 line", OBJPROP_COLOR, Yellow);
      }
      else
      {
      ObjectMove("L4 line", 0, Time[40], L4);
      }
   }
//-------End of Draw Camarilla Lines

//------ Midpoints Pivots

   if (midpivots==true)
   {

      if(ObjectFind("M5 label") != 0)
      {
      ObjectCreate("M5 label", OBJ_TEXT, 0, Time[0], M5);
      ObjectSetText("M5 label", " M5", 8, "Arial", EMPTY);
      }
      else
      {
      ObjectMove("M5 label", 0, Time[0], M5);
      }

      if(ObjectFind("M4 label") != 0)
      {
      ObjectCreate("M4 label", OBJ_TEXT, 0, Time[0], M4);
      ObjectSetText("M4 label", " M4", 8, "Arial", EMPTY);
      }
      else
      {
      ObjectMove("M4 label", 0, Time[0], M4);
      }

      if(ObjectFind("M3 label") != 0)
      {
      ObjectCreate("M3 label", OBJ_TEXT, 0, Time[0], M3);
      ObjectSetText("M3 label", " M3", 8, "Arial", EMPTY);
      }
      else
      {
      ObjectMove("M3 label", 0, Time[0], M3);
      }

      if(ObjectFind("M2 label") != 0)
      {
      ObjectCreate("M2 label", OBJ_TEXT, 0, Time[0], M2);
      ObjectSetText("M2 label", " M2", 8, "Arial", EMPTY);
      }
      else
      {
      ObjectMove("M2 label", 0, Time[0], M2);
      }

      if(ObjectFind("M1 label") != 0)
      {
      ObjectCreate("M1 label", OBJ_TEXT, 0, Time[0], M1);
      ObjectSetText("M1 label", " M1", 8, "Arial", EMPTY);
      }
      else
      {
      ObjectMove("M1 label", 0, Time[0], M1);
      }

      if(ObjectFind("M0 label") != 0)
      {
      ObjectCreate("M0 label", OBJ_TEXT, 0, Time[0], M0);
      ObjectSetText("M0 label", " M0", 8, "Arial", EMPTY);
      }
      else
      {
      ObjectMove("M0 label", 0, Time[0], M0);
      }

//---- Draw Midpoint Pivots on Chart
      if(ObjectFind("M5 line") != 0)
      {
      ObjectCreate("M5 line", OBJ_HLINE, 0, Time[40], M5);
      ObjectSet("M5 line", OBJPROP_STYLE, STYLE_DASHDOTDOT);
      ObjectSet("M5 line", OBJPROP_COLOR, Blue);
      }
      else
      {
      ObjectMove("M5 line", 0, Time[40], M5);
      }

      if(ObjectFind("M4 line") != 0)
      {
      ObjectCreate("M4 line", OBJ_HLINE, 0, Time[40], M4);
      ObjectSet("M4 line", OBJPROP_STYLE, STYLE_DASHDOTDOT);
      ObjectSet("M4 line", OBJPROP_COLOR, Blue);
      }
      else
      {
      ObjectMove("M4 line", 0, Time[40], M4);
      }

      if(ObjectFind("M3 line") != 0)
      {
      ObjectCreate("M3 line", OBJ_HLINE, 0, Time[40], M3);
      ObjectSet("M3 line", OBJPROP_STYLE, STYLE_DASHDOTDOT);
      ObjectSet("M3 line", OBJPROP_COLOR, Blue);
      }
      else
      {
      ObjectMove("M3 line", 0, Time[40], M3);
      }

      if(ObjectFind("M2 line") != 0)
      {
      ObjectCreate("M2 line", OBJ_HLINE, 0, Time[40], M2);
      ObjectSet("M2 line", OBJPROP_STYLE, STYLE_DASHDOTDOT);
      ObjectSet("M2 line", OBJPROP_COLOR, Blue);
      }
      else
      {
      ObjectMove("M2 line", 0, Time[40], M2);
      }

      if(ObjectFind("M1 line") != 0)
      {
      ObjectCreate("M1 line", OBJ_HLINE, 0, Time[40], M1);
      ObjectSet("M1 line", OBJPROP_STYLE, STYLE_DASHDOTDOT);
      ObjectSet("M1 line", OBJPROP_COLOR, Blue);
      }
      else
      {
      ObjectMove("M1 line", 0, Time[40], M1);
      }

      if(ObjectFind("M0 line") != 0)
      {
      ObjectCreate("M0 line", OBJ_HLINE, 0, Time[40], M0);
      ObjectSet("M0 line", OBJPROP_STYLE, STYLE_DASHDOTDOT);
      ObjectSet("M0 line", OBJPROP_COLOR, Blue);
      }
      else
      {
      ObjectMove("M0 line", 0, Time[40], M0);
      }

   }
//----End of Midpoint Pivots Draw

//---- End Of Program
   return(0);
//#include "comment.mq4"

  }
//+------------------------------------------------------------------+
Comments