Pretty_t3_LK_V1.2
Download script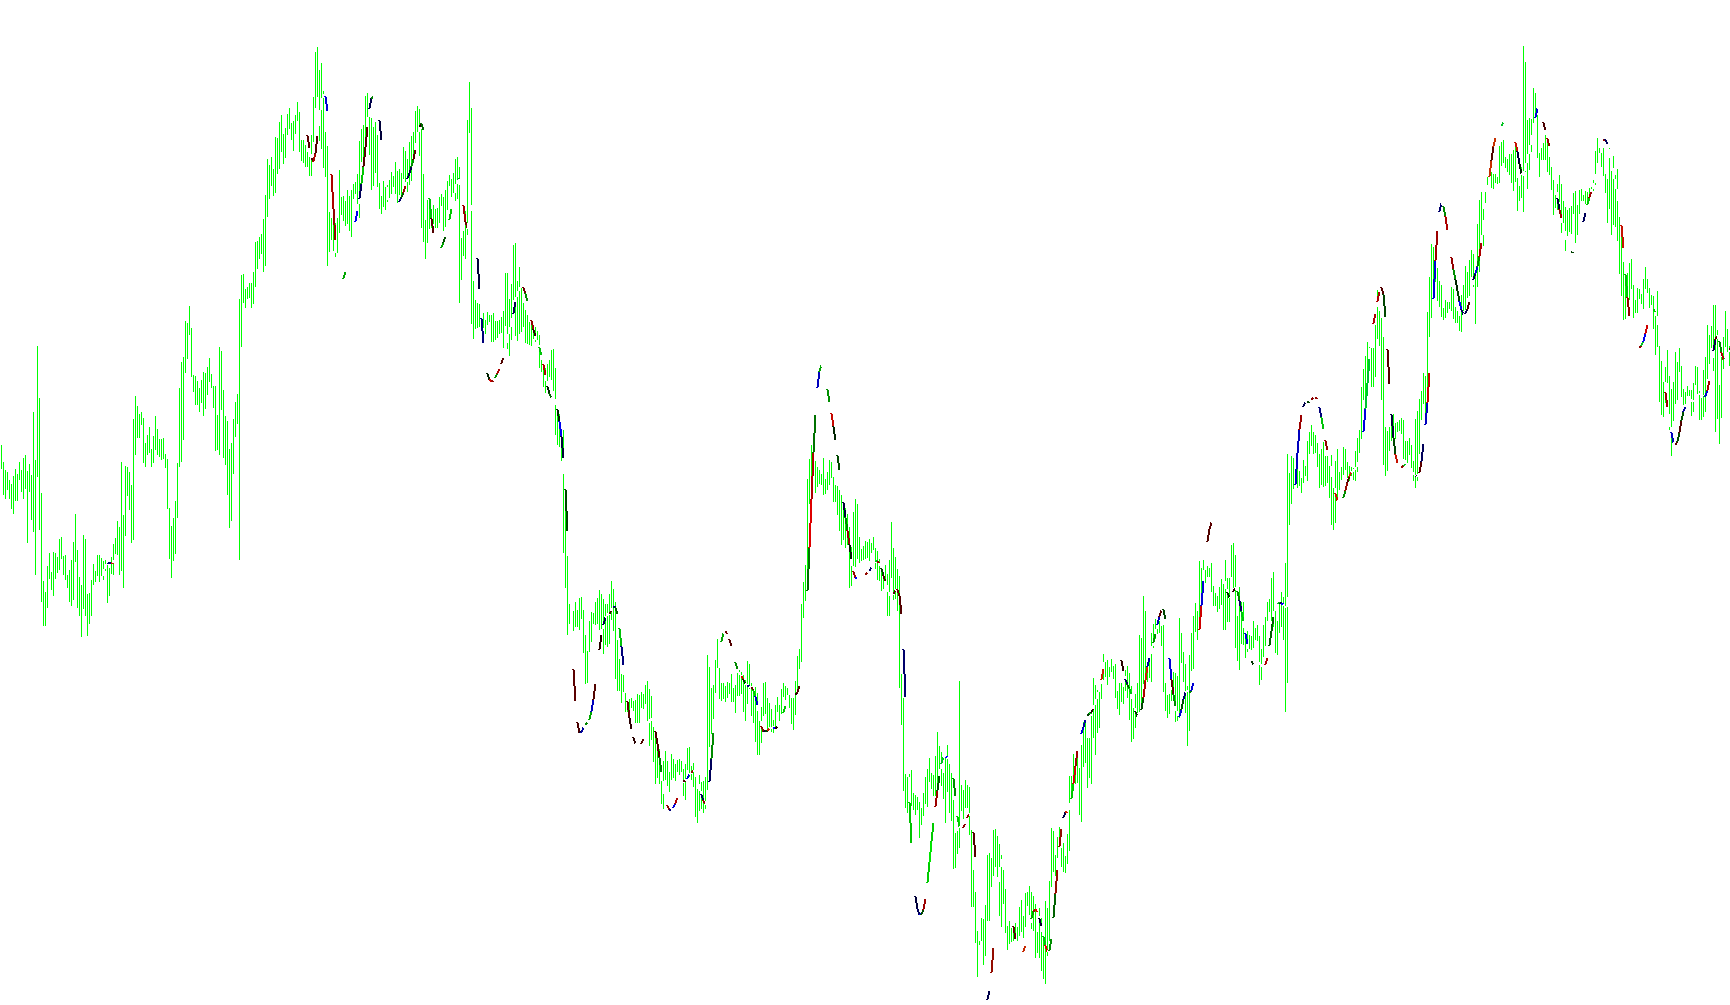
This tool is designed to provide a visual representation of market trends by smoothing out price action. It utilizes the "T3" moving average logic, which is specifically engineered to balance two often-conflicting goals in trading: reducing the "lag" (the delay between a price move and the indicator's reaction) while maintaining a smooth line that isn't distracted by minor market noise.
Core Logic and Functionality
1. The T3 Smoothing Process Unlike a standard moving average that simply averages prices over a set period, this script uses a multi-layered approach. It takes the base price (such as the Close, Open, High, or Low) and passes it through several successive rounds of mathematical smoothing. By layering these calculations on top of one another, the indicator creates a highly responsive curve that stays closer to the actual price than a standard moving average would, while still filtering out erratic "wiggles" in the data.
2. Trend Strength Detection Beyond just drawing a line, the script calculates the underlying momentum of the market. It looks at the rate of change in the T3 value relative to the market's recent volatility (measured via Average True Range). This produces a "Trend Filter"—a value that determines how strongly the price is moving in one direction versus another.
3. Visual Presentation Modes The script offers two distinct ways to display this information on your chart:
- Dynamic Color Mode (RGB Mode): When enabled, the indicator changes color based on the calculated trend strength. It creates a fluid visual transition where the line shifts from one color to another as momentum picks up or fades, allowing you to see the "health" of a trend at a glance.
- Directional Step Mode: If RGB mode is turned off, the script identifies whether the current price is higher or lower than the previous price point. It then draws specific "Up" and "Down" lines, making it easier to identify distinct shifts in direction.
User Configuration Options
The logic can be adjusted through several key settings:
- T3 Period: Determines how much historical data is considered (higher numbers make the line smoother but slower).
- T3 Amp: Adjusts the "responsiveness" of the curve.
- Applied Price: Allows you to choose which price data to follow (e.g., looking at the Highs/Lows instead of just the Close).
- Price Shift: Offsets the calculation forward or backward on the chart to align with specific trading styles.
//+------------------------------------------------------------------+
//|                                            Pretty_t3_LK_V1.2.mq4 |
//|                         Orginal T3 calculation by Tim Tillson in |
//|     Technical Analysis of Stocks and Commodities - January 1998. |
//|                     Source code Copyright © 2009, Leif Karlsson. |
//|                                        Leffemannen1973@telia.com |
//+------------------------------------------------------------------+
//| Please feel free to copy, modify and / or redistribute this      |
//| software / source code in any way you see fit.                   |
//+------------------------------------------------------------------+
//+ ********************* Shameless Ad. **************************** +
//+ * I do custom programing jobs in Java, C, X86 Assembler & MQL4 * +
//+ ***** Pleace do not hesitate to get in contact if you nead ***** +
//+ ***** something special: EA, indicator or somthing else. ******* +
//+ ****************** Leffemannen1973@telia.com ******************* +
//+ **************************************************************** +
//+------------------------------------------------------------------+
#property copyright "Copyright © 2009, Leif Karlsson"
#property link      "mailto://Leffemannen1973@telia.com"
//+------------------------------------------------------------------+
#property  indicator_chart_window
#property  indicator_buffers 2
#property  indicator_color1  Blue
#property  indicator_color2  Red
#property  indicator_width1  2
#property  indicator_width2  2
//+------------------------------------------------------------------+
extern int T3Period = 7;
extern double T3Amp = 1.3;
extern string AppliedPriceText1 = "Close: 0, Open: 1, High: 2, Low: 3";
extern string AppliedPriceText2 = "Median: 4, Typical: 5, Weighted: 6";
extern int AppliedPrice = 4;
extern int PriceShift = 0;
extern int MaxBars = 1000;
extern bool RGBMode = true;
//+------------------------------------------------------------------+
// Index Buffers
double UpBuffer[];	// Up trend buffer (only used then RGBMode = false)
double DwBuffer[];	// Down trend buffer (only used then RGBMode = false)
double t3[]; 		// Main T3 value (always used)
double Trend[]; 		// Primitive trend filter (max 1, min -1): InvFisher(0.5*Sqrt(T3Period)*[T3 Rate of change] / ATR) (always used)

// Used for T3 calc
double c1;
double c2;
double c3;
double c4;

// "Fake" Index Buffers, advance forward using ArrayCopy
double p1[];
double p2[];
double p3[];
double p4[];
double p5[];
double p6[];

// T3 Alpha (weight)
double Alpha;

string IndiName;
bool FirstRun;
datetime LastTime = 0;
//+------------------------------------------------------------------+
int deinit() {

	int i = MaxBars;
	while(i >= 0 && RGBMode) {
		ObjectDelete(IndiName + i);
		i--;
	}
	return(0);
}
//+------------------------------------------------------------------+
int init() {
	// Index Buffers
	IndicatorBuffers(4);

   	SetIndexStyle(0, DRAW_LINE);
   	SetIndexStyle(1, DRAW_LINE);

   	SetIndexBuffer(0, UpBuffer);
   	SetIndexBuffer(1, DwBuffer);
   	SetIndexBuffer(2, t3);
   	SetIndexBuffer(3, Trend);
   	//

   	// "Fake" Index Buffers
	ArrayResize(p1, MaxBars+1);
	ArrayResize(p2, MaxBars+1);
	ArrayResize(p3, MaxBars+1);
	ArrayResize(p4, MaxBars+1);
	ArrayResize(p5, MaxBars+1);
	ArrayResize(p6, MaxBars+1);

	ArraySetAsSeries(p1, true);
	ArraySetAsSeries(p2, true);
	ArraySetAsSeries(p3, true);
	ArraySetAsSeries(p4, true);
	ArraySetAsSeries(p5, true);
	ArraySetAsSeries(p6, true);
	//

	IndiName = "T3, T3Period: " + T3Period + ", T3Amp: " + T3Amp + ", PriceShift: " + PriceShift + " ";
   	IndicatorShortName(IndiName);

   	Alpha = 2.0/(T3Period + 1.0);

	// Pre calc some T3 values
   	double a = T3Amp;
   	c1 = -a*a*a;
	c2 = 3.0*a*a + 3.0*a*a*a;
	c3 = -6.0*a*a - 3.0*a - 3.0*a*a*a;
	c4 = 1.0 + 3.0*a + a*a*a + 3.0*a*a;
	//

	FirstRun = true;

   	return(0);
}
//+------------------------------------------------------------------+
void Draw(double Val[], int i, color c) {

	string ObjName = IndiName + (Time[i]/(60*Period())) % MaxBars;

      ObjectDelete(ObjName);
      ObjectCreate(ObjName, OBJ_TREND, 0, Time[i+1], Val[i+1], Time[i], Val[i]);
      ObjectSet(ObjName, OBJPROP_RAY, false);
      ObjectSet(ObjName, OBJPROP_STYLE, STYLE_SOLID);
      ObjectSet(ObjName, OBJPROP_COLOR, c);
      ObjectSet(ObjName, OBJPROP_WIDTH, 2);
}
//+------------------------------------------------------------------+
int start() {

	int i = IndicatorCounted();
	if(i < 0) return(-1);
	i = Bars - i;
	if(i > MaxBars) i = MaxBars;
	if(FirstRun || i == MaxBars) {
		FirstRun = false;
		LastTime = Time[0];

		p1[i] = iMA(NULL, 0, 1, 0, 0, AppliedPrice, i+PriceShift);
		p2[i] = p1[i];
		p3[i] = p1[i];
		p4[i] = p1[i];
		p5[i] = p1[i];
		p6[i] = p1[i];
		t3[i] = p1[i];
		i--;
	}
	else {
		int j = ArrayBsearch(Time, LastTime, MaxBars, 0, MODE_DESCEND);
		if(j > 0) {
			ArrayCopy(p1, p1, j, 0, ArraySize(p1)-j);
			ArrayCopy(p2, p2, j, 0, ArraySize(p2)-j);
			ArrayCopy(p3, p3, j, 0, ArraySize(p3)-j);
			ArrayCopy(p4, p4, j, 0, ArraySize(p4)-j);
			ArrayCopy(p5, p5, j, 0, ArraySize(p5)-j);
			ArrayCopy(p6, p6, j, 0, ArraySize(p6)-j);
		}
		LastTime = Time[0];
	}

	while(i >= 0) {

		// Main T3 calc
		double p0 = iMA(NULL, 0, 1, 0, 0, AppliedPrice, i+PriceShift);
		p1[i] = p1[i+1] + Alpha*(p0 - p1[i+1]);
		p2[i] = p2[i+1] + Alpha*(p1[i] - p2[i+1]);
		p3[i] = p3[i+1] + Alpha*(p2[i] - p3[i+1]);
		p4[i] = p4[i+1] + Alpha*(p3[i] - p4[i+1]);
		p5[i] = p5[i+1] + Alpha*(p4[i] - p5[i+1]);
		p6[i] = p6[i+1] + Alpha*(p5[i] - p6[i+1]);

		t3[i] = c1*p6[i] + c2*p5[i] + c3*p4[i] + c4*p3[i];
		//

		// Trend strength calc
		Trend[i] = 0.5*MathSqrt(T3Period)*(t3[i]-t3[i+1]) / iATR(NULL, 0, T3Period, i+PriceShift);
		Trend[i] = ((1.0-MathExp(-2.0*Trend[i]))/(1.0+MathExp(-2.0*Trend[i])));
		//

		if(RGBMode) {
			int b = 127.0 + 127.0*Trend[i];
			int r = 127.0 - 127.0*Trend[i];
			Draw(t3, i, b << 16 + r);
		}
		if(!RGBMode && t3[i] > t3[i+1]) {
			UpBuffer[i] = t3[i];
			DwBuffer[i] = EMPTY_VALUE;
			if(UpBuffer[i+1] == EMPTY_VALUE) UpBuffer[i+1] = t3[i+1];
		}
		if(!RGBMode && t3[i] < t3[i+1]) {
			DwBuffer[i] = t3[i];
			UpBuffer[i] = EMPTY_VALUE;
			if(DwBuffer[i+1] == EMPTY_VALUE) DwBuffer[i+1] = t3[i+1];
		}

		i--;
	}

   	return(0);
}
Comments