StepMA_v6.2
Download script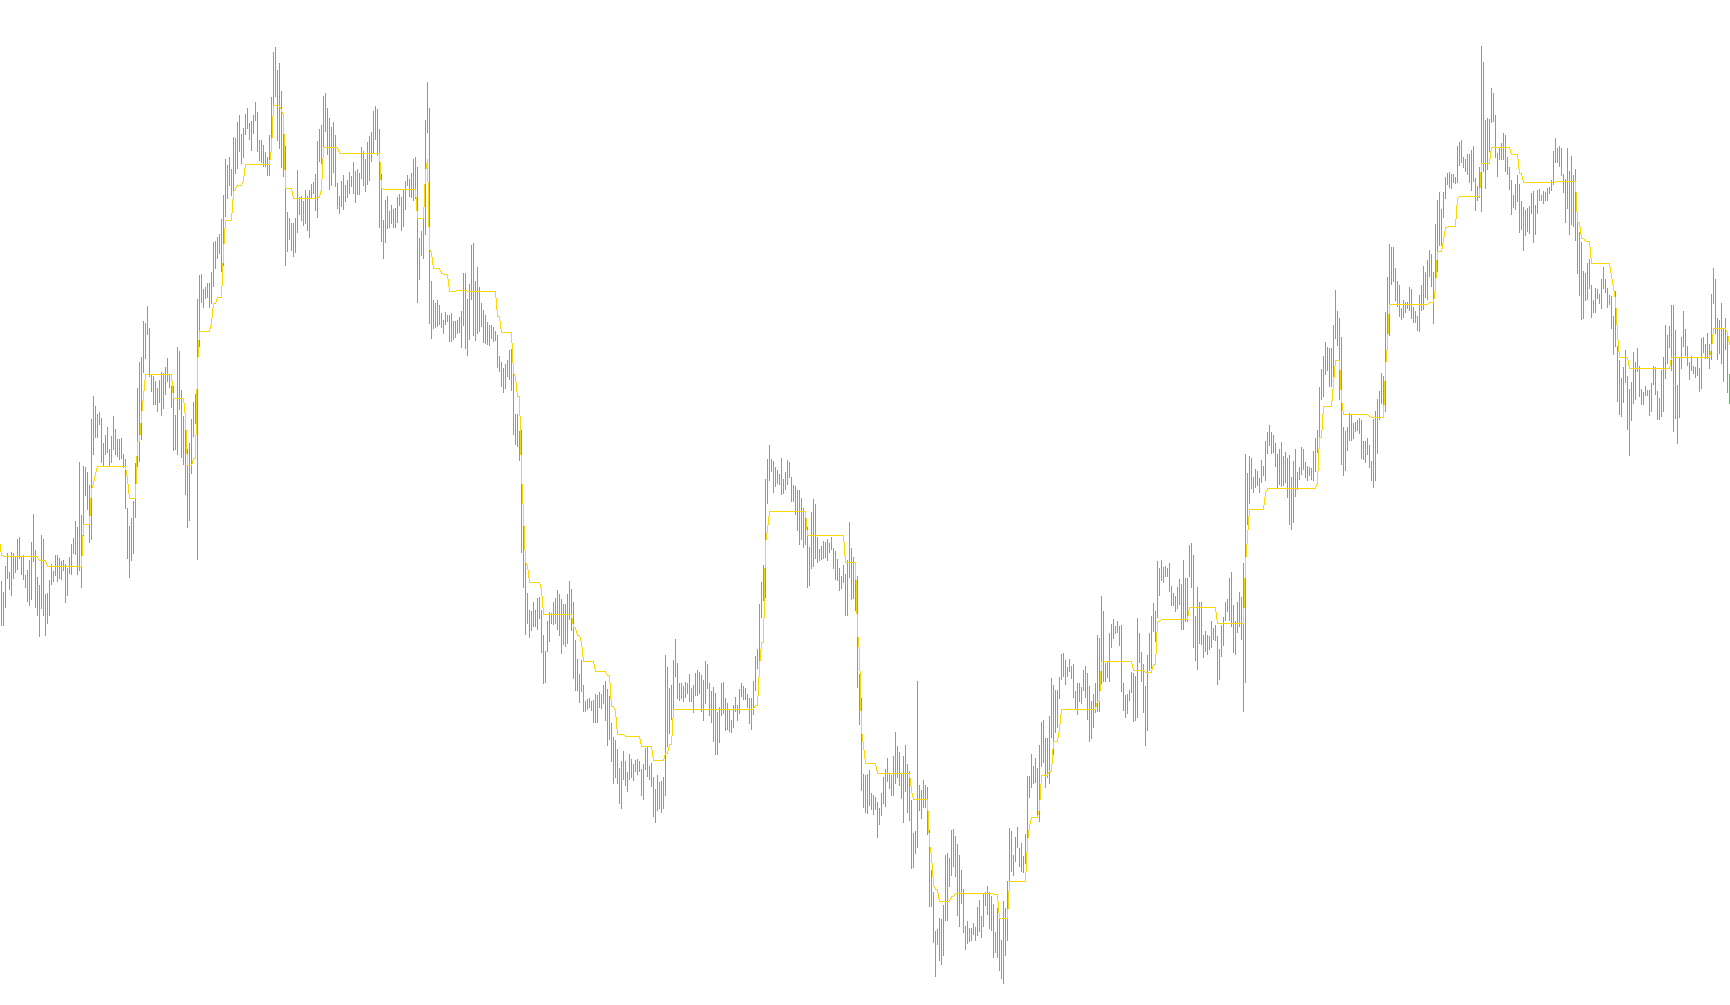
The StepMA indicator is a technical analysis tool designed to help traders identify market trends by smoothing out price fluctuations and highlighting clear directional movements. Unlike standard moving averages that create smooth, curving lines, this script generates a "stepped" visual effect, where the indicator moves in distinct horizontal plateaus.
Core Logic and Functionality
The logic of this script revolves around three main components: volatility measurement, trend detection, and the "step" mechanism.
1. Volatility-Based Step Calculation
The script first determines how "large" each step should be. It looks at a specific number of previous candles to analyze market volatility.
- Dynamic Mode: If left to its default settings, the script calculates the average range (the distance between highs and lows) over a set period. It then identifies the maximum and minimum ranges to establish a consistent step size relative to the current market environment.
- Manual Mode: Users can also provide a fixed step size if they prefer a constant movement regardless of market volatility.
2. Trend Identification
The indicator monitors whether the price is breaking out above or below a calculated threshold. It maintains a "memory" of the previous state to determine the current direction:
- Upward Trend: If the closing price rises above the established upper boundary, the script identifies an upward trend.
- Downward Trend: If the closing price falls below the established lower boundary, the script identifies a downward trend.
3. The Stepping Mechanism
Once a trend is identified, the indicator "locks" onto a level. Instead of following every minor price tick (which creates "noise"), the line stays flat until the price moves significantly enough to break the current step.
- Price Reference: Depending on the settings, the script calculates these boundaries based either on the High/Low prices or the Closing prices. High/Low mode is generally more sensitive to quick price spikes, while Closing price mode provides a smoother trend analysis.
- Visual Output: The result is a series of horizontal steps that clearly delineate the market's path. When the price successfully breaks a step, the indicator "steps" up or down to the next level, providing a visual representation of structural changes in the market.
Summary for Traders
The StepMA acts as a filter. It ignores minor market "chatter" and only updates its position when there is a confirmed move in price. By visualizing the market in these discrete steps, it helps traders identify the prevailing direction and potential support or resistance levels more clearly than a standard fluctuating line.
//+------------------------------------------------------------------+
//|                                                    StepMA_v6.mq4 |
//|                           Copyright © 2005, TrendLaboratory Ltd. |
//|                                       E-mail: igorad2004@list.ru |
//+------------------------------------------------------------------+
#property copyright "Copyright © 2005, TrendLaboratory Ltd."
#property link      "E-mail: igorad2004@list.ru"

#property indicator_chart_window
#property indicator_buffers 3
#property indicator_color1 LightBlue
#property indicator_color2 Blue
#property indicator_color3 Red
//---- input parameters
extern int     Length=10;      // ATR Length
extern double  Kv=1.0;         // Sensivity Factor
extern int     StepSize=0;     // Constant Step Size (if need)
extern int     Advance=0;      // Offset
extern bool    HighLow=false;  // High/Low Mode Switch (more sensitive)
extern bool    Color=false;    // Color Mode Switch
//---- indicator buffers
double LineBuffer[];
double UpBuffer[];
double DnBuffer[];
double smin[];
double smax[];
//+------------------------------------------------------------------+
//| Custom indicator initialization function                         |
//+------------------------------------------------------------------+
  int init()
  {
   string short_name;
//---- indicator line
   IndicatorBuffers(5);
   //SetIndexStyle(0,DRAW_LINE,STYLE_SOLID,1);
   SetIndexStyle(1,DRAW_ARROW);
   SetIndexStyle(2,DRAW_ARROW);
   SetIndexArrow(1,159);
   SetIndexArrow(2,159);
   //SetIndexShift(0,Advance);
   SetIndexShift(1,Advance);
   SetIndexShift(2,Advance);
   SetIndexBuffer(0,LineBuffer);
   SetIndexBuffer(1,UpBuffer);
   SetIndexBuffer(2,DnBuffer);
   SetIndexBuffer(3,smin);
   SetIndexBuffer(4,smax);

   IndicatorDigits(MarketInfo(Symbol(),MODE_DIGITS));
//---- name for DataWindow and indicator subwindow label
   short_name="StepMA("+StepSize+","+Kv+","+StepSize+")";
   IndicatorShortName(short_name);
   //SetIndexLabel(0,short_name);
   SetIndexLabel(1,"UpTrend");
   SetIndexLabel(2,"DownTrend");
//----
   SetIndexEmptyValue(0,0.0);
   SetIndexEmptyValue(1,0.0);
   SetIndexEmptyValue(2,0.0);

   //SetIndexDrawBegin(0,Length);
   //SetIndexDrawBegin(1,Length);
   //SetIndexDrawBegin(2,Length);
//----
   return(0);
  }

//+------------------------------------------------------------------+
//| StepMA_v6                                                         |
//+------------------------------------------------------------------+
int start()
  {
   int i,shift,trend,Step;
   double smin0,smax0,smin1,smax1,ATRmin=10000,ATRmax=0,AvgRange,ATR0;


   for(shift=Bars-Length-1;shift>=0;shift--)
   {

   if( StepSize==0 )
   {
        AvgRange=0;
	     for (i=Length-1;i>=0;i--)
	     {
            AvgRange+= (High[shift+i]-Low[shift+i]);
        }
	     ATR0 = AvgRange/Length;

	if (ATR0>ATRmax) ATRmax=ATR0;
	if (ATR0<ATRmin) ATRmin=ATR0;

	Step=0.5*Kv*(ATRmax+ATRmin)/Point;
	}
	else
	{Step=Kv*StepSize;}

	Comment (" StepSize= ", Step);
	if (HighLow)
	  {
	  smax[shift]=Low[shift]+2.0*Step*Point;
	  smin[shift]=High[shift]-2.0*Step*Point;
     }
	else
	  {
	  smax[shift]=Close[shift]+2.0*Step*Point;
	  smin[shift]=Close[shift]-2.0*Step*Point;
	  }

	  if (Close[shift]>smax[shift+1])  trend=1;
	  if (Close[shift]<smin[shift+1])  trend=-1;

	  if(trend>0)
	  {
	  if(smin[shift]<smin[shift+1]) smin[shift]=smin[shift+1];
	  LineBuffer[shift]=smin[shift]+Step*Point;
	  if(Color) {UpBuffer[shift]=smin[shift];DnBuffer[shift]=-1.0;}
	  }
	  else
	  {
	  if(smax[shift]>smax[shift+1]) smax[shift]=smax[shift+1];
	  LineBuffer[shift]=smax[shift]-Step*Point;
	  if(Color) {DnBuffer[shift]=smax[shift];UpBuffer[shift]=-1.0;}
	  }

	 }
	return(0);
 }
Comments